|
Where Have All the Road Salts Gone, Long Time Migrating data | hook | main | background & resources | student Peter M. Amati, Jr. Holliston High School Holliston, Ma. 01746 School Phone 508-429-0677 amati@tea.rice.edu Overview
Grade Level/Discipline National Standards 1.Benchmarks 12C, State Standard: Massachusetts' frameworks
1. Strand 1 Inquiry #'s 1 -34
Time Frame Engagement and Exploration (Student Inquiry Activity) Start with a discussion of the fact that because we live in a climate where we have snow and ice we, as a society, are compelled to come up with ways to make our roadways safe. Raise the question,. What are some of the ways we remove snow and ice from our roadways? (Plowing sanding and salting.) Have the kids describe how and why these methods work. During this discussion raise the question,. What do the highways signs saying "WARNING!! Watershed area, minimal road salt used" mean and what is the significance of these signs? (Many kids have noticed the movement of road salt into the environment as the obvious browning of grass, shrubs and trees along roads edge or arcticles from the local papers about the pollution of wells/ground waters by road salt.) Pursue the idea that the road salts, if they migrated, might end (in fact do) end up polluting various, ponds, puddles, pools and wells. Question how we could measure movement of road salts? (Responses vary from spectrophotometry or measuring the conductivity of the snow on the side of the road to tasting the snow for salts at different distances from the road's edge. At this point I describe one part of my work in Antarctica, measuring the migration of salt in cores of ice taken from sea ice. (Because the sea water freezes from above [water -2�C air -30�C] the freezing point depression causes the water on the top to freeze first. This forces the salt out of the upper layer and makes the layer below saltier. As the freezing continues the salt continues to migrate out of that layer into yet deeper layer of the ice making the lower layers of ice still saltier.) The purpose of this research was to document the type of ice (fresh/ various concentrations of salt) that was found in that parcticular area that had been photographed by satellites. (Ground truthing). Ask students to read about Peter Amati's research in the Weddell Sea on the Teachers Experiencing the Antarctic and Arctic web site ../../tea_amatifrontpage.html#calendar On the day of the snow storm or the day after (must allow time for road to be sanded and salted and plowed) the student will employ the protocol set out in Student Reproducible Masters.
Explanation (Discussing)
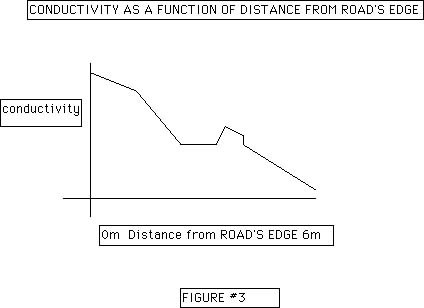
The graph indicates that the conductivity (salt concentration) decreases with distance from the road's edge. The second peak was totally unexpected, but shows up on almost all data sets suggesting strongly that it is not an aberration. Data analysis suggests (remember this is real research, there is no definitive answer) that this peak, high concentration of salt, is probably due to the speed of the plow and the temperature which both influence how far a splash of road's edge snow is forced deeper within our field of measurement. Great challenge for kids (isn't this what its all about) and a great opportunity for extension of research/project.
Elaboration (Polar Applications)
 Satellite Image of Sea Ice in Weddell Sea (taken from http://southport.jpl.nasa.gov/polar/sarimages.html) Ask students to read about Peter Amati's research in the Weddell Sea on the Teachers Experiencing Antarctica and the Arctic web site ../../tea_amatifrontpage.html Another interesting reference can be found on the GLACIER web site at ../../expedition/2_trainingcamp.html Both sites will give insite into the research that goes on in Antarctica. Have the students go to the following website http://www.ce.vt.edu/enviro2/gwprimer/roadsalt/roadsalt.html This site will allow the students to see a real life application to their real life research. Have the student go to the following website http://southport.jpl.nasa.gov/polar/index.html This web site will provide an explanation of statilite imagery Exchange (Students Draw Conclusions)
Evaluation (Assessing Student Performance)
data | hook | main | background & resources | student |