|
Ozone and Temperature Data Analysis, South Pole Antarctica data | hook | main | background & resources | student Elke Bergholz, UNIT, 24 - FDR Drive, New York, N.Y. 10034 ebergholz@unis.org Teachers Experiencing Antarctica (TEA) parcticipant, National Science Foundation (NSF), in collaboration with Climate Monitoring and Diagnostic Laboratory, National Oceanographic and Atmospheric Administration (NOAA), Boulder Colorado, D. Hofmann, Principal Investigator. Overview
Objectives Grade Level/Discipline National Standards Grades 5 - 8 Content Standard A: Scientific Inquiery Content Standard D: Earth and Space Science Content Standard E: Science and technology Content Standard F: Science in Personal and Social Perspectives Content Standard G: History and Nature of Science
http://www.iceberg.co.nz/eduresou.htm Time Frame
This activity was also conducted in a 120 min time period which included the discussion time without pre discussion time Engagement and Exploration (Student Inquiry Activity) 2. Step: Discuss with your students:
3. Step: Read Elke Bergholz’s journals of January 2,3,and 4 about the stay in New Zealand Go to : ../../ Go to: meet the TEA’s Go to: Elke Bergholz Go to: Elke’s Daily Journal Click on January 2, 3, and 4 individually and read journals . ( Note: if not enough computers with internet access is available, it might be useful to have copies of the journals for students). 4. Step: Tell your student to continue to imagine the ozone scientist scenario and his/her arrival in Antarctica Imagine that you will be at the South Pole for the whole summer season, October until February. (I was at the South pole for 4 weeks in January/ February.) This is your first time for you to go to the Antarctic and you will be going all the way to the South Pole. How exciting!! You will be at the bottom of the world. Have students read my journal from January 9th and 10th : Arrival in McMurdo and at the South Pole. 5. Step: Discuss with your student: what is actually ozone? a) Definition: ( Journal excerpt entry 1/22) What is ozone? Ozone derives from ordinary oxygen (O2). It is the most important trace constituent in the stratosphere. Although it is present in relative concentrations of no more than a few parts per million, it is such an efficient absorber of ultra violet light (UV light) that it is the largest source of heat in the atmosphere at altitudes between about 10 km and 50 km. UV absorption by ozone causes the temperature inversion that is responsible for the existence of the stratosphere. (see your plots of temperature and altitude, see also CMDL's web page at wwwcmdl.noaa.gov ). Ozone is also an important radiator, with strong emission bands in the 9.6 mm infrared region. In the UV-B region (290 - 315 nm) it absorbs with an efficiency that increases exponentially with decreasing wavelength, and so strongly that at 290 nm the radiation at the ground is reduced by more than a factor of 10 to the 4th from that above the ozone layer. This strong variation of absorption efficiency with wavelength in the UV-B region is the basis of the Dobson operational method (see journal 1/14) Ozone is the main source of the highly reactive OH radical, which causes the removal of many organic molecules from the atmosphere. In the troposphere, it is also a pollutant, which means that its natural concentration is increased by human activity. Because its extra oxygen bond can be easily broken, ozone is a strong oxidant that is both corrosive to materials and toxic to plants and animals. A principal of human smog, it is produced in and downwind of urban centers by photochemical reactions involving organic hydrocarbons and oxides of nitrogen. Some intrusions of stratospheric air are also a significant source of ozone in the troposphere. b) make a model of 1. an Ozone molecule: Material Procedure: connect 3 balls with each ball representing one oxygen molecule. 2. the layers of the atmosphere Material Procedure
4. Step: To understand the launching of ozone balloons: have students read the journals: It is time to get to work and collect ozone data. Read the journals about how ozone detectors work and how the ozone balloons are launched.
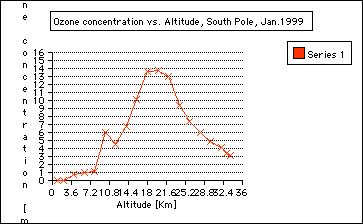
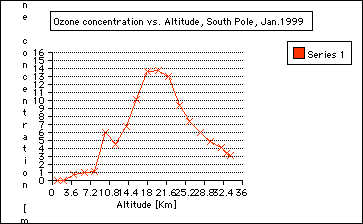
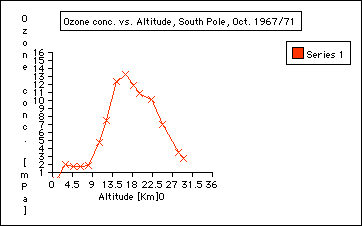
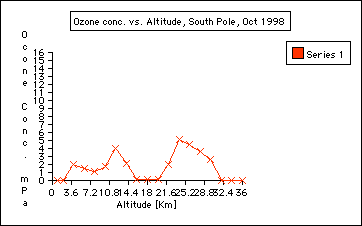
Principle of an ozonesonde: As I have described in my journals from the summer, these sonds are two electro-chemical cells . One is an anode and the other a cathode. Both cells contain potassium iodide solutions. While the balloonrises, a small piston pump pumps air through the solution. The ozone in the pumped air reacts with the iodine solution and produces ions that create a current, which is proportional to the ozone concentration in the air. The piston pump operates by a buttery. An electronic interface board translates all the data points to the radiosonde. The radiosonde submits the data to a converter. The radio signals are converted into the computer language and the measurements appear as a graph plotted with rising altitude. 5. Step: Plotting of ozone data: During my time on the ice, we had to launche balloons in temperatures below minus 21 Celsius. The coldest day was minus 40 Celsius. Imagine how well planned everything had to go. The plotting, however, was done by the computer. a) Divide the class in different groups and use three different sets of data, see Appendix for data and results. Groups: 1. Ozone Data, October 1967/71 2. Ozone Data, October 1998 3. Ozone Data, January 1999 b) Have students follow the instructions of General Activity Description (see Student Reproducible Masters) c) One representative of the group should transfer the plot onto a transparent overhead paper d) Present all data to class using an overhead by overlaying the group data Explanation (Discussing) 1. Where do we find the most ozone concentration in January? In the Stratosphere, from about 15 to 25 kilometers. See graph.
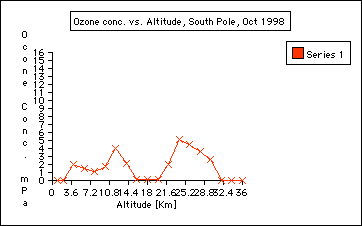
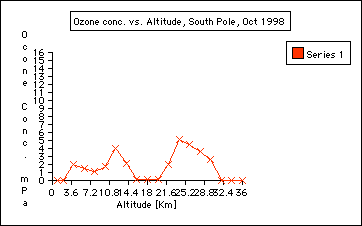
2. Are there seasonal ozone concentration differences? ( Compare the ozone data collected in October 1998 and Jan 1999) Ozone concentration in the stratosphere is almost "0" in October 1998 compared to January of 1999. This indicates the depletion of ozone during the Antarctic Spring time in September and October. This is called the Antarctic ozone hole: the Antarctic ozone hole is seasonal. It is often misunderstood that the ozone hole over the Antarctic exists all year around, which is not true: the Antarctic ozone hole is seasonal. See also Background information journal entires:
3. Where in the atmosphere is the ozone whole? The ozone hole is located in the stratosphere and it is not a solid hole throughout the atmosphere. ( See graph: October 1998). However, there is an overall depletion of ozone up to 10% throughout the world
Total ozone loss: excerpt journal entry 1/26, emailo interview with Dr. Bryan Johnson, CMDL, Boulder, Colorado " The question about ozone loss is hard to answer - since ozone is always being produced and destroyed. The average rate of decline in total ozone is about 4 to 6% per decade (10 years). I think the number the students are asking about may be that the total ozone destroyed over Antarctica in one season represents about 3% of the ozone in the atmosphere. The main idea to have the students understand is that ozone is not a limited quantity in the atmosphere that we are running out of - it is a balance of destruction and production processes, and when we have excess chlorine in the stratosphere then we reach a lower level of balance - because chlorine adds an extra (very effective) destruction process. Ozone is produced mostly in the equator regions, but the dynamics of wind and currents transport ozone out of the tropics and to the mid-latitudes where it tends to build up." 4. Can we observe annual differences in ozone concentrations? Compare the ozone data collected in October 1967 with those collected in October 1998. Data plots will reveal that the ozone hole did not exist in the late 60ties. (See Graphs)
The first CFC’s produced and used took several decades to make it to the Stratosphere. Therefore, not enough CFC’s were available yet in the late 60ties (see October 1967 data) to deplete the stratosphere compared to the October 1998 ozone data which shows the stratospheric ozone depletion. Elaboration (Polar Applications) Questions: 1. How does the temperature change in the atmosphere? 2. Research on Total Ozone: a) Compare total ozone data (compared to the ozone profile you plotted) collected with the ozonesonde with total ozone collected with the DOBSON. Go to total ozone archives. (Total ozone collected at the South Pole is listed in the heading of each data set.) http://www.cmdl.noaa.gov/owv Questions: 1. What are typical ground levels of ozone and total ozone levels? About 300 2. What is a DOBSON unit? See Journal entry: b) Comparison of Satellite TOMS ozone data using TOMS data archives: http://jwocky.gsfc.nasa.gov/eptoms/toda.html Exchange (Students Draw Conclusions) 1. Ozone is mostly abundant in the stratosphere. 2. The Ozone depletions happens seasonal : in the Antarctic springtime: September/ October. 3. The depletion of the stratospheric ozone during the Antarctic spring has decreased since the 60ties to almost zero. 4. Ozone depletion happens because of CFC’s brought down to the Antarctic via atmospheric circulation where it combines with a single ozone molecule which is then not available anymore for ozone formation. 5. The seasonal Antarctic stratospheric ozone hole will close again during the month of November and December with ozone produced in the equator reagion and circulated to the Pole. 6. There is an overall loss of ozone of about 5 -10% Evaluation (Assessing Student Performance) 1. Graphing skills assessment: 2. Drawing conclusions about the data: 3. Incorporating and synthesizing written information with the plotting information: data | hook | main | background & resources | student |

