
|
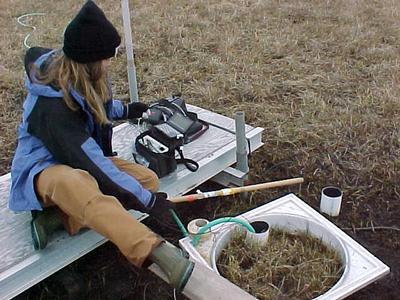
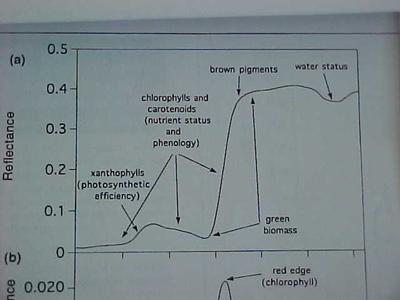
27 June, 2001Wednesday This morning Glen and I had a conference call with 25 people some of who were high school teachers, slated to go to the Antarctic/ Arctic this year. Glen filled them in on his on going work and I for the most part filled them in on the research from a teacher's perspective. Went out to the site this afternoon to continue to count plants! We should be done by tomorrow. I don't think I will ever forget Dupontia frigitas for the rest of my life! The sad thing though is that it only grows up here! Erika was at the site taking reflectance measurement today. This is the first time she has done this to Glen's entire site. The instrument she is using is called a Unispec Reflectometer. While we can see (with our eyes) that the plots are greening up, using the instrument allows us to optically distinguish the changes in the leaf pigments over time. When measurements are repeated, in a week, they will be relatively compared to this week's measurement and will allow us to say, for example, that plot 1-1 is 10% greener than it was last week. The instrument is the choice for the Cal State LA project because it is non destructive and easy to use in the field. In the arctic, leaves are small and do not necessarily have the size necessary for testing. This, plus the chemical analysis time and money other alternative methods involve, add to the convenience of using the spectrometer. If you look at the picture where Erika is holding a wood pole over the plot you can see a silver probe extending down from the tip. This probe senses the light striking the plants and divides the reflected light into wavelengths of the visible and NIR (near infrared) through a diffraction grating in the instrument. On the instrument's screen a spectral reflectance curve is generated and represents the light reflected off of the plants which can then be divided into a number of indices which are used to infer physiological properties. These spectral reflectance curves will change through out the growing season. It is important to note that different species, because of physiological differences, will show varying reflectance indices and different plants growing together will also produce different spectral reflectance indexes. Erika is getting a measurement from each plot that will be compared to curves taken throughout the season. The NDVI (normalized difference vegetative index) is a relative measure, which is mathematically derived from the red and NIR wavelengths, which provides some measure of light absorption by photosynthetic tissues. People use NDVI to model photosynthetic processes through time. The NDVI assigns a number between 0 and 1 that gives you a measure of plant greenness based on pigment content. Photosynthetic pigments, chlorophyll being one (carotenoids and anthocyanins being others), capture solar energy, and control light absorption for carbon uptake. NDVI is a widely recognized index that is influenced by vegetation structure and chlorophyll content and can be correlated with seasonal plant development. To validate the ability of the Unispec to measure spectral reflectance one could use other conventional, destructive, wet chemical techniques to calibrate their results to make sure that each method does correlate with the other. When these tests were both done the indices were strongly correlated with area based chlorophyll content of plants, meaning the use of the spectrometer in the field is a valid data gathering devise and produces similar results and employs less time consuming and costly procedures. Given this John wants to find out if the spectral data he is collecting on his track (or anywhere in the tundra here) will correspond to Glen's CO2 flux data and the tower flux data. To do this Erika is monitoring each individual plot and their treatment and compiling spectral reflectance curves for each. These will be compared to Glen's flux data to see if reflectance and flux correlate. If changes of chlorophyll over time can be correlated with Glen's CO2 flux data through the different treatments then more will be known about how the tundra is involved in carbon exchange and another indirect way of measuring flux can be developed. The question is can you infer carbon uptake by plants from the reflectance curves of the plant in this parcticular situation? As we were at the site Rommel completed one of his 3 transects of the day. He flies from Barrow to Atkasook, 60 km, about 30 feet above the ground at all times, taking meteorological measurements and recording flux data with the various instruments on the plane. This is the regional part of the research project that is so important and was impossible to do up to two years ago before the Sky Arrow was purchased. No other study of flux takes in the large area that this one does (in km.) and that is why it is so important. Three separate but integral parts; Glen's flux data from a small site perspective, Hjojung's flux data from a 400m. tower radius perspective and Rommel's area flux data from a large section perspective all are acting to corroborate each other's data. When all the data is compiled each portion should paint a clearer and larger picture of what is occurring in the arctic as far as CO2 exchange.
Contact the TEA in the field at . If you cannot connect through your browser, copy the TEA's e-mail address in the "To:" line of your favorite e-mail package. |