30 June, 2001
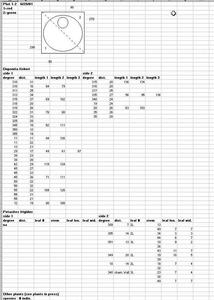
This is how the growth data is being initially displayed. As you can see Dupontia fisheri grass was located in place, logged and then a sample of the population was measured and recorded. We will be repeating measurements throughout the season. Other species are also being followed.
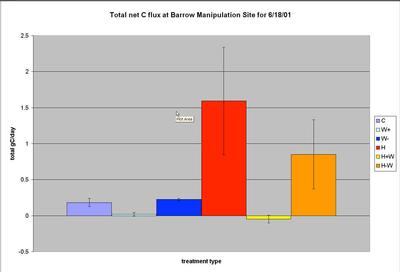
This graph was generated from the first diurnal we did this season. Glen has a control plot plus 5 different treatments in each of the three blocks. Notice a larger flux is occuring in the plots which are exposed to heat. This may be due to the heat increasing microbial activity in the soil. The plots with low water have less flux due to surpressed respiration.
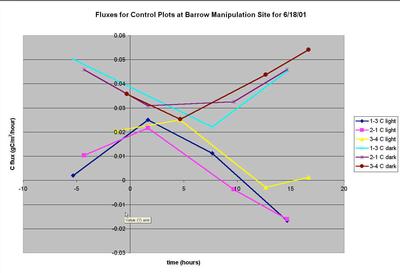
This data is from the 3 control plots at the site. Notice the dark measurements (when we coverer the LiCor to simulate darkness) show increased CO2 in the chamber . During nightime respiration the vegetation acts as a source of CO2. The light measurements show a decreased amount of CO2. During the day the vegetation takes up CO2 in the process of photosynthesis.
Contact the TEA in the field at
.
If you cannot connect through your browser, copy the
TEA's e-mail address in the "To:" line of
your favorite e-mail package.
|