
|
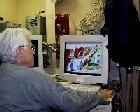
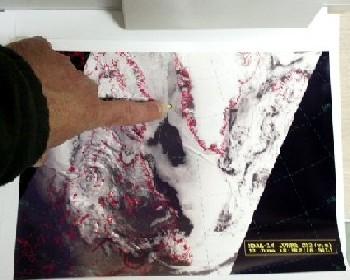
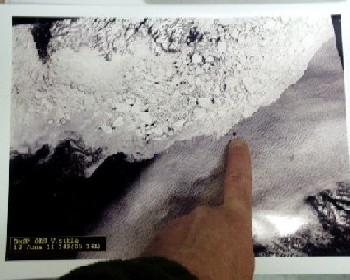
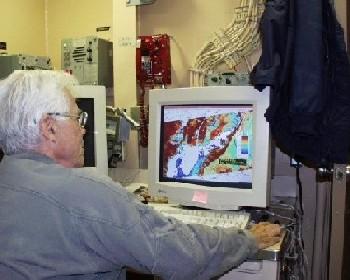
11 June, 2000Ice; From a Bird's Eye Point of View At 9 A.M., the USCGC Healy left Nuuk, Greenland and headed out to open water. The beginning of our cruise was beautiful with clear skies and blue water. Unfortunately, our luck did not last too long. We soon were enveloped in a shroud of fog. On the bridge, careful attention was paid to the location of other marine traffic as we made our way to sea. So where in the world are we going and how will we know just where to go? The answers to those questions are the focus of my journal entry for today. The Healy is to have its propulsion system checked again, so we need to reach ice flows that will put up enough resistance to satisfy the demands required. To find such an ice flow, the Healy utilizes meteorological satellite imaging software known as Tera Scan. I spoke with Bob Whritner to learn about one of the uses of the software, identifying ice flows. Bob Whritner is a manager with the Arctic and Antarctic Research Center at Scripps Institution of Oceanography. Bob trains members of the Coast Guard on the use of the Tera Scan software. He has been invited on this leg of the ice trials to help crewmembers develop their skills in using and interpreting data received from the microwave sensors on NOAA and military satellites. During this cruise three basic types of satellite images will be analyzed; visible spectrum, infrared, and microwave. The visible spectrum images are just what you would expect them to be. They are actual camera images that need little enhancement. During cloud free weather, you cannot get any better information. The second type of image is the infrared image. Infrared imaging uses the differences in the temperatures of objects to form an image. In a polar climate where temperatures of water and ice tend to vary little, this type of imagery is not very practical in locating ice. Also one needs clear weather to get a detailed image of the surface of the water, infrared cannot "see" through clouds. Infrared imaging is most useful with weather data collection and forecasting. The third type of image uses information gathered from microwaves that are emitted from the water and ice to the satellites. This information is much more detailed and takes more expertise to interpret the data correctly. Microwave data can be used to determine the percent concentration of an ice flow. It can also help determine whether the ice flow is made up of first year or multi-year ice, based on the type of microwaves emitted. Microwave data can even give an indication of wind speed, based on the features of the surface of the water. All of this information can be gathered, whether the skies are clear or cloudy. Microwave data is not dependent on weather conditions. Based on the images below, we set sail to the East coast of Nunavut to find the ice needed for the propulsion testing. More information about meteorological data collection will follow in a future journal entry. Todd
Contact the TEA in the field at . If you cannot connect through your browser, copy the TEA's e-mail address in the "To:" line of your favorite e-mail package. |