
|
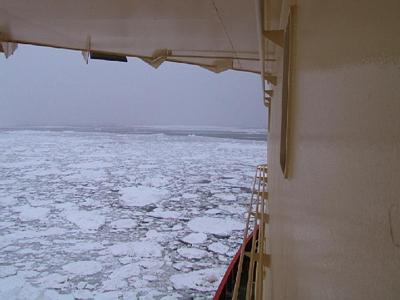
19 March, 2000Fast Air and Heavy Water 73 25 s, 101 48 w Two kilometers from Cosgrove Ice Shelf, between Canisteo and King peninsulas Depth 950m (3116 feet) Wind NE 40 knots (46 mph) gusting to 45 knots (52 mph), temp 1.3 C (30 F) In the gray light of dawn the Nathaniel B. Palmer is a short distance west of the Cosgrove Ice Shelf, in two meter swells blown ragged on top. The clouds are darker gray charcoal smears against a gray sky. A haze of snow blows off the top of the shelf, and forms a white foggy layer above the sea. We've had two fast moving storms come and go here in the last twelve hours, the first about seven o'clock last night and the second about two in the morning. The evening storm had the worst winds I've seen so far here. For a half an hour there were sustained winds of 60-70 knots (69-81 mph), with occasional gusts in the 80 knot range. I was watching the anemometer readout, and the highest gust I saw was 89 knots (102 mph.) All the pack ice had been blown somewhere west, so we were in open water. I went out on the lee deck to watch the sea. For long periods of time the air/sea boundary blurred, as I stood amazed in the shelter of a winch, holding on and watching. The Nathaniel B. Palmer rolled as much as I've seen it roll, but considering the wind, it was remarkably steady. Of course the wind did not have a long time or distance to act on the water to make waves. The "reach", the distance the wind blows over the water, is short because the wind is blowing directly off the nearby ice shelf. Five of us are sitting in the "mud lab" waiting for a core to come a kilometer up from the bottom. Steve Ager and Christian McDonald are two of the ship's technical people, and Jesse Johnson, Dan Naber and myself are "scientists," the term used for everyone not employed by the ship. We're dressed in orange Mustang flotation suits, hard hats and gloves, more or less muddy. Christian reads a paperback and I fiddle. Everybody is tired. This is the third core we've taken since midnight. While the "scientists" were sampling and storing cores, Steve and Christian were lowering and raising the CTD in the Baltic room next door. When we finally get the core aboard, I forget I'm tired. When I take the cover plates off the square box of mud I find a full corer of subtly different colored layers. The coloring could mean a lot of different things. It might mean layers of sediment from different sources, which would indicate possible current changes. It might mean the presence or absence of diatoms, or oxygen, or a combination of all of these factors. My personal theory, and it is just a theory, is that the colored bands represent advances and retreats of the Cosgrove Ice Shelf front. It is only 2 kilometers away, and we know that the position of the front edge is not constant. Not too long ago, the location of the core could well have been under the floating ice shelf. The sediment deposited then would lack diatoms, and would be very fine grained, with little sand or grit. I take a little mud in my fingers, feeling for grit. There are several layers with none, alternating with layers of coarser sediment. To understand what Synte's Ph.D. thesis is about, you have to know what Antarctic Bottom Water (AABW) is, and how it forms. If you have ever walked an ocean beach in the winter, you've probably seen chunks of sea ice stranded by the tide. If you're in the habit of tasting things (you don't have to admit it if you are) you might have broken off some of the big crystals from the edge and sucked on them. If you did, you would find that they tasted surprisingly fresh, despite the fact that the ice froze from salt water. If you don't live near a winter beach, try this. Mix a half a small spoonful of salt in a plastic or paper cup of water, and taste it. You will, of course, find it salty! For the experiment to work right, it should taste about as salty as tomato soup. If it is too salty, pour half the water out, fill it with fresh, and taste again. Pour about a third of it into another glass or cup and set it aside. Put the remainder in a freezer, someplace where it won't get tipped. Wait a while, at least an hour. The waiting time depends on how salty the water is and how cold the freezer is. Check the water every once in a while, but don't shake it. You should see some ice forming. When the water is partially frozen separate the ice by pouring the liquid off into a third cup. You now have three containers, one with part of the original mixture in it, one with ice crystals, and one with the poured off liquid. Remember which is which, or better yet mark them. Leave them on the counter and let them warm up to room temperature. The ice will melt of course. Now taste the original mixture, and then the melted ice. You should taste less salt in the melted ice. Taste the liquid that you poured from the ice. You will find it is the saltiest tasting of all three. When salt water freezes, the salt tends to stay in the water, and the ice tends to be fresher. What does this have to do with Antarctica and Synte's thesis? Just this: seawater freezes in the oceans around Antarctica. When it does so, the water left behind is saltier, and therefore heavier. It is also cold, because it's in Antarctica to begin with, and cold water is heavy water. Taken together, the temperature and the salinity make the water the heaviest (actually, densest) in all the world's oceans. This is the source of the Antarctic Bottom Water. The details of the process are still being debated, and Synte is building a mathematical model to answer some of the outstanding questions. She wants to determine, as exactly as possible, how much AABW flows where. The AABW is not formed all at once in one place. There is considerable mixing of various water masses in the formation process. Most of the AABW is probably formed in the Weddell Sea, on the other side of the Antarctic Peninsula from our present location, although other places may contribute also. It would seem logical that more AABW would be formed in the Antarctic winter of July and August, but no one knows this for sure. There are other questions, but the basics are known. One way to find out some of the details is to look at tracers, chemicals that are in the water in tiny quantities, but that can be used to identify and track a parcticular water mass. Salinity, oxygen and nutrients are obvious seawater characteristics, but there are others. Two tracers are the radioactive isotope of helium called tritium, and chloroflourocarbons (CFCs.) Remember that CFCs are man made chemicals manufactured in various forms since the 1930s. The only part of the world's ocean where CFCs are not found now is in the deep Pacific. Most tritium in the oceans is also man made, but not in an industrial process. The tritium found in the Amundsen Sea comes from atmospheric hydrogen bomb tests of the 1950s and 1960s. Tritium turns into normal helium with a half-life of about 12.5 years, so it is a good indicator of water's age, the time since a water mass was last at the sea surface. Once the AABW is formed, it pours off the edge of the continental shelf and down underneath the Circumpolar Deep Water, down to the very bottom of the deep ocean basins. A lot of it circulates around Antarctica, but some of it heads north into the Indian, Pacific, and Atlantic Oceans. A big river of this water flows northward along the bottom of the Atlantic, underneath a southward flow of North Atlantic Deep Water (NADW.) Crossing the equator, it is still very close to the temperature it was in the Weddell Sea, and it is detectable well into the North Atlantic. Ocean flows are measured in Sverdrups, one Sverdrup being a flow of one million cubic meters per second. The flow of the Mississippi River depends on the season, but is probably between 0.01 and 0.1 Sverdrups. The AABW northward flow in the Atlantic is about 6 or 7 Sverdrups. We are at another CTD station and Synte and Sally work in the Baltic room collecting samples from the water bottles on the CTD. Dee Breger collects more samples in copper tubes for tritium/helium analysis. All these little puzzle pieces add up to one big picture, which is sketched out but not filled in.
Contact the TEA in the field at . If you cannot connect through your browser, copy the TEA's e-mail address in the "To:" line of your favorite e-mail package. |