
|
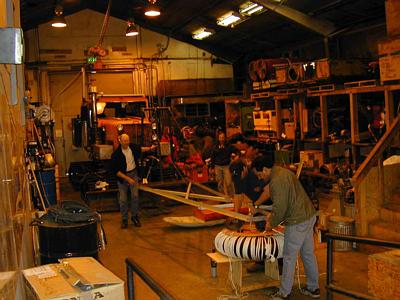
20 November, 1999International Tran-Antarctic Science Expedition! Today I want to tell you about the International Trans-Antarctic Science Expedition (ITASE); a project that has many components with lots of questions being asked and with collaboration with scientists from several countries. Dr. Steve Arcone is a scientist from the Cold Region Research and Engineering Labs (CRREL) and is an expert in radar detection of layering in the ice and snow. In an attempt to understand major climate changes and predict future drastic changes, scientists are trying to understand when the glacier ice cover developed in Antarctica. As part of a way to answer the bigger question there are many other smaller questions that will add information for interpretation by the synthesizer people who look at all of the data from many projects. Some smaller questions are as follows: How fast is snow accumulating? Is the rate rising or falling? How fast has snow accumulated since humans started serious coal burning? How can we accurately date ice cores? Can we find common global events that can be found in the ice? Can we use these events as a marker for analyzing the ice cores? Is the West Antarctic Ice Sheet stable or not? Will it melt and slide into the Southern Ocean? These are just a few of the questions the answers to which, with some data, will contribute to our understanding of global climate change. I will first give you some background on the West Antarctic Ice Sheet, then tell you about the data collection by radar and of what use that data will be. The West Antarctic ice sheet includes the area west of the Trans-Antarctic Mountain Range. It is thought that this area is mostly an area of islands and ocean rather than continuous land. This might be much like the San Juan Islands in the Pacific Northwest. This means that much of the West Antarctic Ice Sheet is lower than sea level and it is about 2000 meters thick. It is also thought that this ice sheet is "riding" on a thin film of liquid water. This liquid water could be the result of the pressure from 2000 meters of ice causing warming enough to melt and form a super-cooled fresh water liquid that is colder than the freezing point normally true for water. Another factor that may be contributing to the liquid layer under the ice is the fact that Ross Sea water could be seeping in under the ice since the area is really an archipelago of islands rather than a land mass. Maybe the ice sheet is "floating" on seawater much like ice that floats. There is evidence of very small changes (in mm) that might be caused by this floating. (At least some think that is one way to interpret the data) We know that there is liquid under this ice sheet because of the ice streams that have been measured as the ice flows over the islands. There are five identified ice streams identified and labeled A -E. The ice streams have regularly flowed about 300 - 400 meters per year. They move toward and into the Ross Ice Sheet and the Ross Sea. The ice in East Antarctica is on land and is moving very slowly compared to the West Antarctic Ice Sheet. The ice in East Antarctica moves only 10 meters per year. It moves very slowly because there is no liquid underlying the ice. To move, it creeps one ice crystal at a time over the crystal in front of it. How can we answer the question of how fast is snow accumulating? Has there been a change since we started burning coal? Using radar as a detection device, one can measure the layers of ice. But, you need to know how old the ice layers are so that you can make meaning from the data on the layers found within the ice cores. One way to determine age of layers within the ice core is to look for markers of known events from the past. This group of scientist is using volcanic eruptions from the past and correlating known events with depth within the ice core where the event occurred. The following "volcanic fingerprints" were found for the 1793 Laki eruption in Iceland; the 1815 Tambora eruption in Indonesia; the 1883 Krakatau eruption near Indonesia; the 1912 Katmai eruption in Alaska and the 1991 Pinatubo eruption. When these eruptions occurred, they not only spewed out rock and dust parcticles, but lots of sulfuric acid. This acid was distributed in the atmosphere around the world and rained /snowed on all the land. Each eruption resulted in a signature profile of the eruption which when snowed upon in Antarctica, became trapped within the ice. So now when a layer of ice is analyzed and compared with a known volcanic event in the past, we know how deep the known layer is so we know how much snow and ice has accumulated since that event. With several markers in place, analyzing an ice core becomes much easier. The Tambbora 1815 eruption evidence is found at 33 meters deep in the ice. Can you now find a way to tell if snow is accumulating rapidly, or not accumulating at all? What other information might be of value? You might want to know that during present time it snows about 11 cm per year. That translates into about 3/4th of an inch of water per year. This is what is found in the layers of ice. There is another factor to consider; that of compression under pressure. Those 11 centimeters of snow that fell a few years ago will compact into about 2 centimeters further down into the ice. Now you know why we need Dr. Steve Arcone and his radar. Using his radar, he can detect the layers and distinguish one from another down to about 50 meters. He can also detect whether or not the layers are straight. Why might this make a difference? What might cause layers to not be flat? If you guessed that the ice bumps up against buried islands and folds around them you are thinking like a scientist. The radar is useful to find good places to take a core of ice. The plan is to take a core of ice every 10n kilometers as they travel along in a large Tucker (a huge tractor like vehicle that moves like a treadmill). In order to make good use of a core, the team must make sure that the core that is taken has flat layers of ice with no folding patterns. Why is folding in an ice core used answer the question about patterns of snowfall in years past a problem? What other things might influence his data? Think about riding along in this Tucker with the radar device suspended from the front of the vehicle hovering about 30 centimeters above the ice, protected by an airplane tire innertube What other use might there be for looking at the layers under the ice, or other surfaces, for that matter? One interesting use for this radar detection is that when the radar hits a crevasse in the ice; one that may be covered by a snow bridge of drifting snow; it will show up as a big break in the layers of ice. Aha! This is where the radar has an n immediate and life saving value to the research team as they traverse the West Antarctic Ice Sheet. We can now return to the original question How fast is snow accumulating in the West Antarctic Ice Sheet. We have a way to find layers. We can identify specific layers correlated to known events. We can measure how much ice accumulated each year and look for a pattern. Is there no change? Is there an increase in precipitation? Is there a loss of ice? Here are a few photos of Dr. Arcone talking with the people in my project. Here is also a photo of getting the equipment rigged up and working. Tomorrow I will tell you how this relates to predicting global climate changes. In the mean time, see if you can figure out how to make use of the information that will be gathered by this research group. Then check out the web site http://www.secretsoftheice.org
Contact the TEA in the field at . If you cannot connect through your browser, copy the TEA's e-mail address in the "To:" line of your favorite e-mail package. |