
|
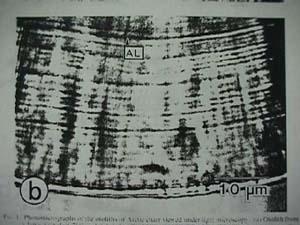
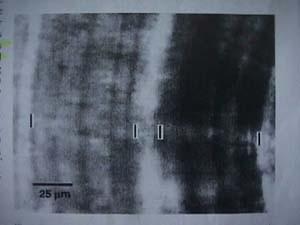
4 August, 1999Aloha from UH--Manoa, Today was a "me on my own" most of the day, as Dr. Radtke was giving a presentation in the morning at an area hospital to recruit students for his oceans of Potentiality program that I referred to in the 07/30/99 journal. I spent the early morning working on my classroom presentation ideas for before I actually go to Greenland. Any students or teachers that have been listening in, if you would like to have me visit your school just send an e-mail and I can visit you. I am prepared to gear my presentation to the age level needed. There are some great curriculum resources that I can share and activities that I can do with students; I would love to be able to visit before (August 17), during, and after with your classroom or group. I finished reading another research arcticle on otoliths. This arcticle dealt with a study Dr. Radtke and others did in Labrador, Canada. In this study a fence was put up at the entrance to a lake, probably somewhat like Jim Finn's weir on the Chena River in Alaska (refer to journal entry 07/14/99). They wanted to know at what age the fish migrate to saltwater, if at all. To do this again they dissected out the otoliths. Otoliths besides having "daily" increments, have wider bands of transparent and opaque areas. There seems to be a correlation between the amount of food being processed and the width of the daily incremental bands. The more food the wider the "daily" incremental band. When viewing the whole otolith these denser bands appear opaque and the wider bands translucent or hyaline. Studies have been done to show that these hyaline bands are deposited in the summer. This seems logical since food is more plentiful in the summer months with the longer days. So now we can estimate the years of age by counting the pairs of light and darker bands. The study also attempted to show when and if the fish had migrated out of the freshwater into the saltwater. To do this they used a microprobe analysis; I will be learning the technique tomorrow and can describe it in more detail then. The microprobe can detect the amount of Strontium (Sr) and the amount of Calcium (Ca) in the otolith across the opaque and hyaline bands. Why? The concentration of Strontium in seawater is greater than in freshwater. The otolith structure can use Strontium or Calcium interchangebly. If you look on the periodic chart you will see that Strontium is right below Calcium; they are members of the same family. Families on the periodic chart have similar characteristics due to their similar atomic structure. If the fish is living and growing in seawater, the amount of Strontium in the otolith structure will spike higher during the microprobe analysis. According to the study in this parcticular population of fish, most migrate to saltwater at the age of 2-3 years during the summer months. Interestingly they found that there were some frequent small spikes during the 1-2 year. This may show some early foraging into saltwater, but no long term residency for the summer. I finshed working on my slide sandwiches for the otoliths and packed them up for Greenland. I am sure I will remember back fondly on the ease with which I manipulated them in the comfort of an airconditioned room at 75 F.

Contact the TEA in the field at . If you cannot connect through your browser, copy the TEA's e-mail address in the "To:" line of your favorite e-mail package. |