|
Frozen Water Before?
I'm Sure You Have; but I Bet You've Never Frozen Salt Water! Water !!!!!!!!
data
| hook
| main
| background & resources
| student
Author Contact Information
Peter M. Amati, Jr.
Holliston High School
Holliston, Ma. 01746
School Phone 508-429-0677
amati@tea.rice.edu
Overview
In this activity students will investigate what happens to salt water when it freezes. Observations of densities and salt concentration (by measuring conductivity)
will be made. These results will be compared with the densities and conductivity conditions found in sea ice cores (columns of frozen sea water taken from the
ocean around Antarctica).
The students will:
- measure salt concentrations
- measure density
- understand the concept of freezing point depression
- tabulate and graph all data sets
- explain results of data
- explain the difference in water density relaive to depth of ice.
- explain the presence of low salt concentration in surface ice and
explain how (stalactites)brine cones form
- compare graphs of salt concentration (conductivity) as a function
of depth of ice with similar graphs formulated from sea ice grown in the
Weddell Sea.
Grade Level/Discipline
Grades 9-12, Physical Science, General Science and Chemistry classes.
National Standards
Science as Inquiry standard A , Physical Science Standard B, Science and
Technology Content standard E, Science in Personal and Social Perspectives
Content standard E
State Standard: Massachusetts' frameworks
1. Strand 1 Inquiry #'s 1 -34
2. Strand 2 Domains of Science
3. Physical Science #'s 3, 64, 69
4. Life Science #'s 46, 47,
5. Earth and Space Science #'s 46, ,63, 65
6. Strand 3 Technology #'s 2, 6, 10, 15, 16, 18, 19, 27, 32, 37, 38, 40, 53,
54, 56, 60, 61, 62, 63, 78
7. Strand 4 Science Technology and Human Affairs #'s 2, 3, 10, 11, 15, 16
Pre-activity set-up
Materials
- conductivity meter
- plastic tube 1" diameter, thin walled and 8"long (Tube used to
protect 8" fluorescent light bulbs work well. Availble at Home Depot or
other. hardware stores
- permission from local supermarket for you (and several students)
to use their frozen food freezer
- make up 35 ppt (parts per thousand) of salt water solution.
- graduate cylinder
- balance
- saw
- plastic bags for samples
- ruler
- pipette
- weighing cup
- salt solution (35 grams of salt/1000ml of water) Will need about
1500ml of solution per each 8" tube filled.
- construction insulation R =11 value (3/12"), 3" length
Time Frame
one hour (before or after school) to go too freezer set up column
("ice core")
one hour (before or after school) to go to freezer, cut and bag
column sections ("ice core")
one period to measure salt concentrations and density of various
sections taken from "ice core"
one period to analyze data sets and compare with sea ice data
Engagement and Exploration (Student Inquiry Activity)
A Protocol that works:
At some point after the concepts of solubility, concentration and freezing
points have been covered introduce the following project.
Temperature -40°F and wind blowing 40 MPH, ah just the right conditions to
go to work. Raise the questions who, what, why and where? Discussion
should be directed to lead to Antarctica. (Have students read the
following web site ../../amati/6.5.1992.html">../../amati/6.5.1992.html">../../amati/6.5.1992.html
Distribute a copy of Student Reproducible Masters. Students will see that
the investigation will center on analyzing the freezing of salt water.
Question what do you think will happen?
(Possible answers: It won't
freeze {"I've never seen ocean water freeze."}; it will freeze like
regular water; it will freeze at a higher or lower temperature {they often
know the effect of dissolved solute on boiling points of liquids.}, it
will only partially freeze. As far as salt concentration is concerned it
will probably stay the same.
(Answer: Salt water will freeze at a
temperature lower then 0°C and the salt concentration will increase as you
get toward the bottom of the container. Water freezes less then 0°C
because of freezing point depress. Salt concentration will increase as
you get deeper into the core)
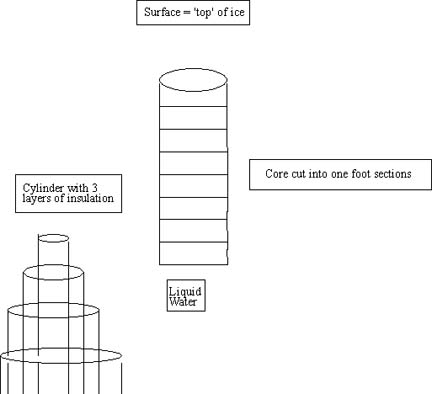
One possible protocol is to:
- wrap three layers of R11 insulation around full length of 8"
plastic pipe.
- stopper plastic tube , fill with 35 ppt salt water and stand
vertically in -20°C freezer till frozen
- when frozen (minimum of 24 hours) cut into 12" sections and place
in separate freezer bags marked so that location from "ice core" is known.
See the figures shown below for proper set up.
- allow melting at room temperature
- test each sample with conductivity meter to determine salt
concentration. (Make sure conductivity meter is standardized. Keep probe
in distilled water. Test sample, record conductivity and record reading.)
- mass weighing cup and using pipette, pipette out 4 ml of
solution; and determine its mass.
- calculate mass of solution in cup. (Subtract mass of cup from cup
plus sample = mass of sample.)
- calculate density of solution in cup. (Divide mass of sample by 4
ml. This will give the density in grams/ml.)
- repeat steps 4 - 7 with each of the sample from the ice core
- graph density (g/ml) as a function of where in ice core sample came
from "depth of ice". . Graph "depth of ice" where in ice core sample came
from as a function of conductivity
- do not give kids this comparison until they have plotted their own
curves. Compare kid's depth of ice core as a function of conductivity
with sample of graph from sea ice core taken from Antarctic ocean.
Explanation (Discussing)
Make transparency of one of better density of the ice (frozen water) as a
function of depth graphs, should look like Figure #. A discussion as to
why this happens should follow. The explanation of this graph is as
follows
- As the water freezes (it freezes from the top since the sides are
insulated) the dissolved salt lowers the freezing point of water to less
then 0°C
- The growing crystals force the salt out (deeper into the "core");
therefore the deeper water becomes denser, because of the greater
concentration of salt.
- The result should be a gradient of density from least (at top) to
most (at bottom)
Make a transparency of one of the better graphs comparing the
kid's depth of ice core as a function of conductivity and compare this
with a sample of graph from sea ice core taken from the Antarctic. See
Figure#.
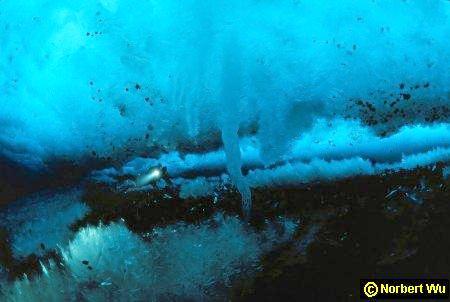
Photo of Sea Ice stalactites formed by salt begin so concentrated that is
literally runs out of the ice.
Taken from http://scilib.ucsd.edu/sio/nsf/gallery/gallery1.html
Ocean water has a salinity of about 35ppt; the top layer of the ice core
is about 8 ppt; the lowest concentration is about 4 ppt (in the "middle"
of the curve) and at the bottom of the core goes back up to 8 ppt. If the
ice is stable and sea ice stalactite form, there is a concentration of the
salt at the bottom end of these brine stalactites ranging anywhere from 70
to 200ppt salt to water.
The explanation of the above is as follows. Surface ice has a relatively
higher salt concentration because turbulence will cause the ice crystals
to be small (thus trapping more salt) It will be lower then normal
seawater because of the freezing point depression phenomenon. Once a
"cover" is put on the water (a layer of stable ices) columnar (long
crystals) ice forms, there is less room here so less water gets trapped.
This, in conjunct with the freezing point depression phenomenon, causes
the concentration of salt to go down. The reason the lower part of the
curve goes back up is because of re-supply of water (35ppt) from below.
If brine stalactites form their concentration drips will be so high (70-
200 ppt) because the salt has to go somewhere.
Cross section of sea ice showing top layer of small crystals (frazil ice)
and bottom layer of long crystals (columnar ice).
Taken from http://clim.lowtem.hokudai.ac.jp/teion/sirl-e.html
Elaboration (Polar Applications)
Ask students to read about Peter Amati's research in the Weddell Sea on the Teachers Experiencing Antarctica and the Arctic web site
../../tea_amatifrontpage.html
In parcticular, note the journal entry from June 6, 1992 ../../amati/6.5.1992.html In this entry, Peter describes the extreme cold and dryness of Antarctica.
Another interesting reference can be found on the GLACIER web
site at ../../expedition/2_trainingcamp.html
Exchange (Students Draw Conclusions)
N.B. Graphic presentation along with explanation of these (and their
comparisons) is what is important here.
Evaluation (Assessing Student Performance)
Rubric dealing with formal lab report and graphed data sets.
data
| hook
| main
| background & resources
| student
|

