|
Getting to the Core of Climate Change:
How can we use ice core data from the polar regions to investigate changes in Earth's climate past, present, and future?
data
| hook
| main
| background & resources
| student
Database
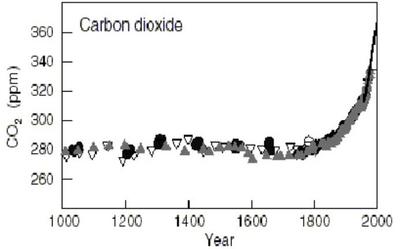
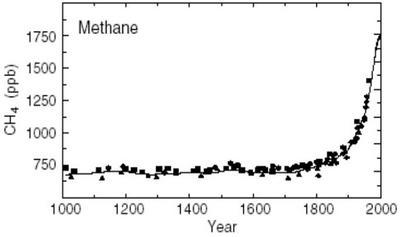

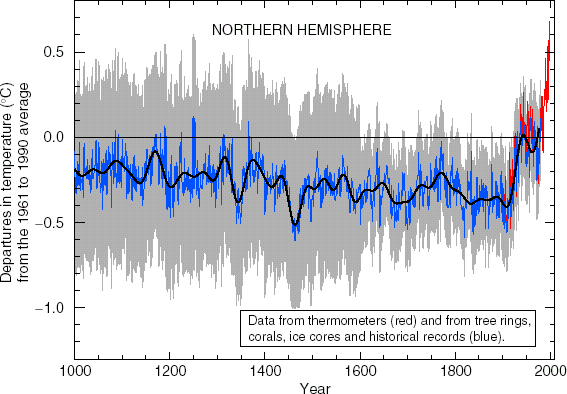
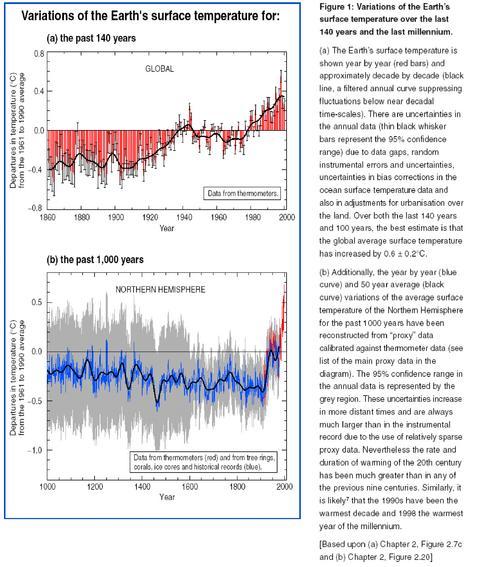
Graphs are from: Climate Change 2001: Working Group I: The Scientific Basis, p. 3: Intergovernmental Panel on Climate Change, Houghton, J.T., Y. Ding, D.J. Griggs, M. Noguer, P.J. van der Linden, X. Dai, K. Maskell, C.A. Johnson, eds.
The data that follow in the tables are from the following site. We have deleted much of the data so that a reasonable
amount of data for hand graphing remains. If you are graphing on a computer, you might choose
to download the data direclty from the site so that you have the data set in its entirety.
The text that follows is from the site referenced. We have changed the years listed (in B.P.;
before present) to actual years, with negative years indicating BC.
http:/
/www.ngdc.noaa.gov/paleo/icecore/greenland/summit/document/gispisot.htm
GISP2 Bidecadal Oxygen Isotope Data
REFERENCES:
Stuiver, M., T.F. Braziunas, P.M. Grootes, and G.A. Zielinski. 1997. Is there evidence for
solar forcing of climate in the GISP2 oxygen isotope record? Quaternary Research
48:259-266.
Stuiver, M., P.M. Grootes, and T.F. Braziunas. 1995. The GISP2 18O climate record of the
past 16,500 years and the role of the sun, ocean and volcanoes. Quaternary
Research 44:341-354.
Meese, D.A., R.B. Alley, R.J. Fiacco, M.S. Germani, A.J. Gow, P.M. Grootes,
M. Illing, P.A. Mayewski, M.C. Morrison, M. Ram, K.C. Taylor, Q. Yang, and
G.A. Zielinski. 1994. Preliminary depth-agescale of the GISP2 ice core.
Special CRREL Report 94-1, US.
Steig, E.J., P.M. Grootes, and M. Stuiver. 1994. Seasonal precipitaion
timing and ice core records. Science 266:1885-1886.
DATA DESCRIPTION:
This file contains the GISP2 bidecadal delta 18O data set back to 16,510 yr B.P., measured at
the Quaternary Isotope Laboratory, University of Washington, as of February 1st, 1997. The
timescale includes revisions by D. A. Meese as of September 1994. The GISP2 depths
below 167 meters are those of the D core; above 167 meters the core depths are those of the
B core + 1.09 meters. See the file gisp2age.dat for further information on the timescale.
Between 1650.29 and 1844.88 meters, the delta 18-O values of this time series are based on
high resolution data (0.2 meter). They differ slightly from the 2-meter time series (file
UW2md18O.dat).
The data columns represent:
- top depths of intervals (in meters)
- mean delta Oxygen 18 values (in per mil) starting at top depths. Standard deviation in a
single delta Oxygen 18 measurement is 0.14 per mil. Multiple measurements (such as for the
ones below) reduce the standard deviation to the 0.05 to 0.1 per mil range.
- layer count ages at top depths (in yr BP) where 0 BP represents AD 1950 SUMMER to
AD 1949 SUMMER
(Added for this exercise: column 4: year AD)
| Depth |
O 18 |
Age |
Year |
| |
|
|
|
| Top (m) |
(per mil) |
age (before present) |
time (AD) |
| |
|
|
|
| |
|
|
|
| |
|
|
|
| 36.85 |
-35.18 |
50 |
1900 |
| |
|
|
|
| 119.2 |
-35.08 |
350 |
1600 |
| |
|
|
|
| 212.31 |
-35.17 |
750 |
1200 |
| |
|
|
|
| 304.02 |
-34.8 |
1150 |
800 |
| |
|
|
|
| 389.62 |
-34.8 |
1550 |
400 |
| |
|
|
|
| 470.32 |
-34.72 |
1950 |
0 |
| |
|
|
|
| 548.74 |
-34.47 |
2350 |
-400 |
| |
|
|
|
| 622.82 |
-35.16 |
2750 |
-800 |
| |
|
|
|
| 695.12 |
-34.12 |
3150 |
-1200 |
| |
|
|
|
| 763.02 |
-35.15 |
3550 |
-1600 |
| |
|
|
|
| 829.43 |
-34.83 |
3950 |
-2000 |
| |
|
|
|
| 892.7 |
-35.39 |
4350 |
-2400 |
| |
|
|
|
| 954.41 |
-35.07 |
4750 |
-2800 |
| |
|
|
|
| 1013.63 |
-34.68 |
5150 |
-3200 |
| |
|
|
|
| 1069.27 |
-34.55 |
5550 |
-3600 |
| |
|
|
|
| 1121.41 |
-34.52 |
5950 |
-4000 |
| |
|
|
|
| 1172.74 |
-34.62 |
6350 |
-4400 |
| |
|
|
|
| 1223.15 |
-34.28 |
6750 |
-4800 |
| |
|
|
|
| 1270.57 |
-35.04 |
7150 |
-5200 |
| |
|
|
|
| 1317.18 |
-34.55 |
7550 |
-5600 |
| |
|
|
|
| 1363.05 |
-34.68 |
7950 |
-6000 |
| |
|
|
|
| 1405.96 |
-34.81 |
8350 |
-6400 |
| |
|
|
|
| 1447.99 |
-34.61 |
8750 |
-6800 |
| |
|
|
|
| 1488.56 |
-35.06 |
9150 |
-7200 |
| |
|
|
|
| 1525.95 |
-34.6 |
9550 |
-7600 |
| |
|
|
|
| 1560.4 |
-35 |
9950 |
-8000 |
| |
|
|
|
| 1592.86 |
-35.82 |
10350 |
-8400 |
| |
|
|
|
| 1621.71 |
-36.21 |
10750 |
-8800 |
| |
|
|
|
| 1648.47 |
-36.76 |
11150 |
-9200 |
| |
|
|
|
| 1672.67 |
-36.39 |
11550 |
-9600 |
| |
|
|
|
| 1686.85 |
-39.18 |
11950 |
-10000 |
| |
|
|
|
| 1697.68 |
-40.77 |
12350 |
-10400 |
| |
|
|
|
| 1708.24 |
-39.03 |
12750 |
-10800 |
| |
|
|
|
| 1723.47 |
-39.25 |
13150 |
-11200 |
| |
|
|
|
| 1740 |
-37.93 |
13550 |
-11600 |
| |
|
|
|
| 1759 |
-37.35 |
13950 |
-12000 |
| |
|
|
|
| 1779.23 |
-36.51 |
14350 |
-12400 |
| |
|
|
|
| 1800 |
-39.54 |
14750 |
-12800 |
| |
|
|
|
| 1811.32 |
-39 |
15150 |
-13200 |
| |
|
|
|
| 1821.23 |
-38.48 |
15550 |
-13600 |
| |
|
|
|
| 1830.95 |
-41.43 |
15950 |
-14000 |
| |
|
|
|
| 1840.98 |
-40.23 |
16350 |
-14400 |
Lake Vostok Carbon Dioxide Data
This data is from the following web site and refernce below. We have changed this data so that
there is a reasonable anount to graph by hand. If you are going to be graphing with computers,
you might want to download the data directly from the site referenced to have a complete set.
There are 5 columns of data, the last two are the ones to graph, the year and CO2 information.
The other three columns are information about the sample; the depth in the ice core and the year
in BP (before present.) You may notice that there is a difference between the ice age and the
gas age; this is due to the gas in the snow rising before it froze completely.
Please note that the years for each data point are not uniformly spaced.
ftp://ftp.ngdc.noaa.gov/pal
eo/icecore/antarctica/vostok/co2.txt
Barnola et al, Nature 329, 408-414 1987
| Depth |
ice Age |
Gas age |
CO2 |
Year (AD) |
| |
|
|
|
|
| m |
years |
years |
ppmv |
|
| |
|
|
|
|
| 124.6 |
4050 |
1700 |
274.5 |
300 |
| |
|
|
|
|
| 173.1 |
5970 |
3530 |
270 |
-1530 |
| |
|
|
|
|
| 250.3 |
9320 |
6800 |
252 |
-4800 |
| |
|
|
|
|
| 266 |
10040 |
7500 |
257 |
-5500 |
| |
|
|
|
|
| 302.6 |
11870 |
9140 |
259 |
-7140 |
| |
|
|
|
|
| 375.6 |
16350 |
12930 |
245 |
-10930 |
| |
|
|
|
|
| 426.4 |
20330 |
16250 |
193 |
-14250 |
| |
|
|
|
|
| 474.2 |
24280 |
20090 |
194.5 |
-18090 |
| |
|
|
|
|
| 525.1 |
28530 |
24390 |
200 |
-22390 |
| |
|
|
|
|
| 576 |
32680 |
28720 |
198 |
-26720 |
| |
|
|
|
|
| 602.3 |
34770 |
30910 |
223 |
-28910 |
| |
|
|
|
|
| 625.6 |
36600 |
32800 |
207 |
-30800 |
| |
|
|
|
|
| 651.6 |
38600 |
34870 |
210 |
-32870 |
| |
|
|
|
|
| 700.3 |
42320 |
38660 |
207 |
-36660 |
| |
|
|
|
|
| 748.3 |
45970 |
42310 |
178.5 |
-40310 |
| |
|
|
|
|
| 775.2 |
48000 |
44350 |
200 |
-42350 |
| |
|
|
|
|
| 800 |
49850 |
46220 |
207.7 |
-44220 |
| |
|
|
|
|
| 852.5 |
53770 |
50150 |
201 |
-48150 |
| |
|
|
|
|
| 874.3 |
55450 |
51770 |
201 |
-49770 |
| |
|
|
|
|
| 902.2 |
57660 |
53860 |
219.5 |
-51860 |
| |
|
|
|
|
| 926.8 |
59670 |
55780 |
214.5 |
-53780 |
| |
|
|
|
|
| 951.9 |
61790 |
57800 |
206.5 |
-55800 |
| |
|
|
|
|
| 975.7 |
63880 |
59770 |
201 |
-57770 |
| |
|
|
|
|
| 1002.5 |
66230 |
62080 |
192 |
-60080 |
| |
|
|
|
|
| 1023.5 |
68040 |
63960 |
193 |
-61960 |
| |
|
|
|
|
| 1052.4 |
70470 |
66540 |
205.5 |
-64540 |
| |
|
|
|
|
| 1074.8 |
72330 |
68490 |
226.5 |
-66490 |
| |
|
|
|
|
| 1101.4 |
74500 |
70770 |
243 |
-68770 |
| |
|
|
|
|
| 1124.19 |
76330 |
72690 |
235 |
-70690 |
| |
|
|
|
|
| 1148.69 |
78270 |
74720 |
230.5 |
-72720 |
| |
|
|
|
|
| 1175 |
80320 |
76860 |
219.5 |
-74860 |
| |
|
|
|
|
| 1225.69 |
84220 |
80900 |
222.5 |
-78900 |
| |
|
|
|
|
| 1251.5 |
86220 |
82820 |
234 |
-80820 |
| |
|
|
|
|
| 1274.19 |
87980 |
84700 |
218.8 |
-82700 |
| |
|
|
|
|
| 1299.3 |
89940 |
86680 |
210 |
-84680 |
| |
|
|
|
|
| 1322.5 |
91760 |
88520 |
221.5 |
-86520 |
| |
|
|
|
|
| 1349 |
93860 |
90630 |
226 |
-88630 |
| |
|
|
|
|
| 1374.8 |
95910 |
92700 |
234 |
-90700 |
| |
|
|
|
|
| 1402.5 |
98130 |
94940 |
226.5 |
-92940 |
| |
|
|
|
|
| 1425.5 |
100000 |
96810 |
236 |
-94810 |
| |
|
|
|
|
| 1451.5 |
102210 |
98950 |
225 |
-96950 |
| |
|
|
|
|
| 1476.09 |
104410 |
101040 |
229 |
-99040 |
| |
|
|
|
|
| 1499.59 |
106610 |
103130 |
238.5 |
-101130 |
| |
|
|
|
|
| 1526.3 |
109240 |
105620 |
234.5 |
-103620 |
| |
|
|
|
|
| 1547 |
111250 |
107650 |
244 |
-105650 |
| |
|
|
|
|
| 1575.19 |
113850 |
110510 |
233.5 |
-108510 |
| |
|
|
|
|
| 1598 |
115850 |
112700 |
240 |
-110700 |
| |
|
|
|
|
| 1626.5 |
118220 |
115290 |
276 |
-113290 |
| |
|
|
|
|
Lake Vostok Methane Data
This data is from the following web site and refernce below. We have changed this data so that
there is a reasonable anount to graph by hand. If you are going to be graphing with computers,
you might want to download the data yourslef to have a complete set.
ftp://ftp.ngdc.noaa.gov/pal
eo/icecore/antarctica/vostok/ch4.txt
Chappellaz et al, Nature 345,127-131 (1990)
| Age |
CH4 content |
| (BC) |
(PPBV) |
| |
|
| 569 |
668 |
| |
|
| 1701 |
595 |
| |
|
| 4197 |
574 |
| |
|
| 7195 |
667 |
| |
|
| 8537 |
477 |
| |
|
| 9827 |
662 |
| |
|
| 10385 |
642 |
| |
|
| 14242 |
395 |
| |
|
| 16752 |
349 |
| |
|
| 19532 |
348 |
| |
|
| 23172 |
384 |
| |
|
| 24870 |
415 |
| |
|
| 28902 |
432 |
| |
|
| 30796 |
522 |
| |
|
| 33892 |
484 |
| |
|
| 38525 |
441 |
| |
|
| 41598 |
402 |
| |
|
| 45123 |
504 |
| |
|
| 48755 |
514 |
| |
|
| 52574 |
442 |
| |
|
| 56665 |
414 |
| |
|
| 60858 |
434 |
| |
|
| 65396 |
458 |
| |
|
| 69714 |
462 |
| |
|
| 73815 |
438 |
| |
|
| 77642 |
545 |
| |
|
| 81680 |
529 |
| |
|
| 85460 |
417 |
| |
|
| 89806 |
443 |
| |
|
| 93792 |
407 |
| |
|
| 96943 |
480 |
| |
|
| 99037 |
493 |
| |
|
| 103611 |
591 |
| |
|
| 105164 |
437 |
| |
|
| 109253 |
468 |
| |
|
| 113400 |
443 |
| |
|
| 116938 |
515 |
| |
|
| 120577 |
557 |
| |
|
| 124486 |
584 |
| |
|
| 129120 |
620 |
| |
|
| 130788 |
637 |
| |
|
| 132136 |
688 |
| |
|
| 134302 |
526 |
| |
|
| 139040 |
431 |
| |
|
| 141980 |
352 |
| |
|
| 143869 |
374 |
| |
|
| 145485 |
348 |
| |
|
| 147130 |
318 |
| |
|
| 151613 |
345 |
This data is from the following site. We have delted much of the data so that a reasonable
amount of data for hand graphing remains. If you are graphing on a computer, you might choose
to download the data direclty from the site so that you have the data set in its entirety.
The text that follows is from the site referenced. We have changed the years listed (in B.P.;
before present) to actual years, with negative years indicating BC.
This data set may be for more advanced graphers, since the years are not in even intervals.
They are all approximately 2200 years apart, but there is significant variation.
It should also be noted that there is a gas age and an ice age here; there is a slight difference
(approximately 200 years) between these numbers, since before the snowfall completely
freezes, the gas can rise slightly.
ftp://ftp
.ngdc.noaa.gov/paleo/icecore/greenland/summit/gisp2/gases/gispch4.txt
GISP2 Methane Concentrations
REFERENCE:
Brook, E.J., T. Sowers, and J. Orchardo. 1996. Rapid variations in
atmospheric methane concentration during the past 110,000 years. Science
273:1087-1091.
DATA DESCRIPTION:
Gas ages were calculated according to the methods described in Brook et
al. 1996, and are subject to change. Ice ages were calculated by by
linear interpolation from the Meese et al. timescale.
| Year |
CH4 |
Gas Age |
Ice Age |
| |
(ppbV) |
(yr BP 1950) |
(yr BP 1950) |
| |
|
|
|
| 1810 |
754 |
140 |
343 |
| |
|
|
|
| 581 |
665 |
1369 |
1566 |
| |
|
|
|
| -665 |
615 |
2615 |
2809 |
| |
|
|
|
| -2378 |
598 |
4328 |
4524 |
| |
|
|
|
| -4709 |
603 |
6659 |
6854 |
| |
|
|
|
| -6681 |
662 |
8631 |
8819 |
| |
|
|
|
| -7714 |
710 |
9664 |
9874 |
| |
|
|
|
| -9007 |
732 |
10957 |
11251 |
| |
|
|
|
| -9855 |
534 |
11805 |
12493 |
| |
|
|
|
| -10550 |
497 |
12500 |
13105 |
| |
|
|
|
| -11833 |
666 |
13783 |
14153 |
| |
|
|
|
| -12768 |
593 |
14718 |
15299 |
| |
|
|
|
| -15313 |
404 |
17263 |
17892 |
| |
|
|
|
| -18119 |
394 |
20069 |
20638 |
| |
|
|
|
| -23836 |
384 |
25786 |
26551 |
| |
|
|
|
| -27599 |
412 |
29549 |
30745 |
| |
|
|
|
| -31294 |
462 |
33244 |
33728 |
| |
|
|
|
| -33122 |
583 |
35072 |
35949 |
| |
|
|
|
| -35918 |
571 |
37868 |
38208 |
| |
|
|
|
| -37571 |
461 |
39521 |
40255 |
| |
|
|
|
| -39640 |
408 |
41590 |
42110 |
| |
|
|
|
| -41257 |
434 |
43207 |
43764 |
| |
|
|
|
| -43390 |
528 |
45340 |
46072 |
| |
|
|
|
| -46097 |
462 |
48047 |
49145 |
| |
|
|
|
| -47975 |
536 |
49925 |
51357 |
| |
|
|
|
| -50062 |
555 |
52012 |
53467 |
| |
|
|
|
| -53184 |
538 |
55134 |
55426 |
| |
|
|
|
| -55641 |
592 |
57591 |
57275 |
| |
|
|
|
| -57191 |
435 |
59141 |
58671 |
| |
|
|
|
| -59268 |
454 |
61218 |
59874 |
| |
|
|
|
| -60924 |
504 |
62874 |
61161 |
| |
|
|
|
| -63313 |
512 |
65263 |
63067 |
| |
|
|
|
| -65632 |
488 |
67582 |
65520 |
| |
|
|
|
| -68902 |
467 |
70852 |
69567 |
| |
|
|
|
| -71048 |
448 |
72998 |
73105 |
| |
|
|
|
| -73828 |
475 |
75778 |
75933 |
| |
|
|
|
| -75736 |
522 |
77686 |
78223 |
| |
|
|
|
| -77829 |
580 |
79779 |
80453 |
| |
|
|
|
| -79940 |
639 |
81890 |
82506 |
| |
|
|
|
| -82397 |
505 |
84347 |
85022 |
| |
|
|
|
| -84926 |
449 |
86876 |
87479 |
| |
|
|
|
| -87372 |
534 |
89322 |
89492 |
| |
|
|
|
| -89537 |
443 |
91487 |
91549 |
| |
|
|
|
| -92101 |
430 |
94051 |
93565 |
| |
|
|
|
| -95265 |
535 |
97215 |
96132 |
| |
|
|
|
| -98019 |
566 |
99969 |
98648 |
| |
|
|
|
| -99844 |
502 |
101794 |
100725 |
| |
|
|
|
| -101807 |
514 |
103757 |
102855 |
| |
|
|
|
| -103622 |
487 |
105572 |
105081 |
| |
|
|
|
| -105758 |
503 |
107708 |
107898 |
| |
|
|
|
| -108161 |
656 |
110111 |
112078 |
Return to top of page
Back to: TEA Activities Page
data
| hook
| main
| background & resources
| student
|

