
|
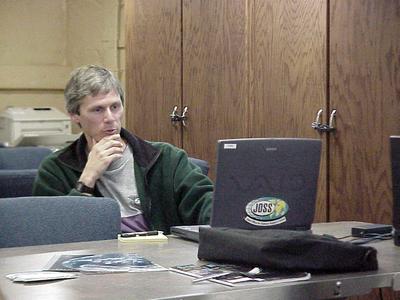
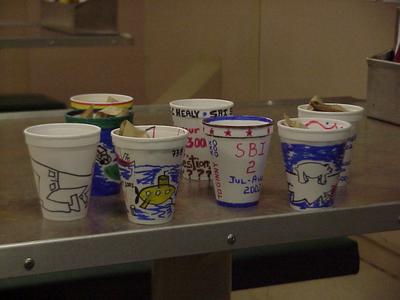
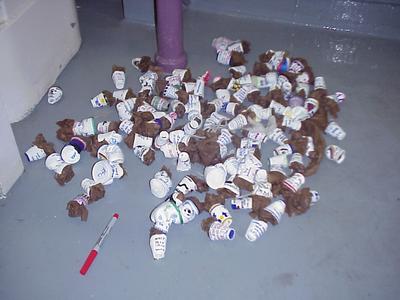
13 August, 2002You have probably noticed Steve Roberts's name in my journals. That's for two reasons. The first is that he was one of two people who worked on my computer for several hours when I had so many problems with it. He also helps when I have problems with computer compatibility between my computer and those on the ship. The other is that he has taken many of the pictures that you see on my page of the TEA website. Fortunately for me Steve didn't bring a camera on board, and he often borrows my digital camera. When he's not helping me or taking pictures he spends all of his time working with the JOSS website. Steve is a software engineer for the Joint Office for Science Support (JOSS), a division of the University Corporation for Atmospheric Research (UCAR), a non-profit, private corporation based in Boulder, Colorado. Steve's job is to keep up to date records of all the ship's sensor data (which is also stored by the U. S. Coast Guard) as well as the data generated by the science service team and by the scientists themselves. The ship's sensor data includes information such as the ship's position, speed and heading, all atmospheric data (weather information) and water conditions such as temperature and salinity. Steve catalogs all the data to be archived (saved for the future) on the JOSS website and to be made available on a daily basis to the scientists on board and back on land. My journals and photos are also on the JOSS website as are Lee Cooper's operational reports. Lee's reports include all the information for each station such as the sampling that was done and when it was done, ice conditions, any problems that arose, etc. The site serves an extremely useful purpose for the scientists. It assists them in documenting and sharing their data in real time (as it is gathered) or close to it. This is not the first time Steve has been on the Healy. From April 27 until May 4, he was on board as the Healy traveled from its home base in Seattle to Nome where it picked up the scientists for the SBI spring cruise. He was on board before the scientists in order to install the field catalog (a catalog of all the data collected in the field) web site and to become familiar with the ship's sensing equipment (i.e. the satellite receivers which give weather data and ice conditions). The primary source of the data which Steve posts is that generated by the service team who analyze the water from the CTD casts. The remainder of the data (that generated by the scientists' on-going analysis) is really only raw data (like a first draft). Before the data are finalized, the scientists must spend time re-analyzing and evaluating it. Eventually, the JOSS site will have all the final data for the cruise, and it will be public information. That will be at least one year after the cruise has ended. So what does Steve do on a daily basis? Any time we are on station he checks the white board in the lab to get an update of the progress on the station. He then gets a copy of the event logs from the bridge in order to extract the science information and he generates a report from it. He will also generate a report each time we reach a new station. All of this data also goes back to the land-based site in Colorado where it is stored. Essentially, Steve is continually updating the website. Like all of us, he finds the shallow stations that happen relatively quickly, the toughest since he needs to document all the information in a shorter period of time, but it's critical that the data is available to the scientists on a daily basis. Whenever Steve is not sitting in front of his computer, he spends time learning about the data and the people who generate it in order to report it accurately. Much of the data is available to the public at the JOSS website <http://www.joss.ucar.edu/sbi/catalog>. In addition to the science that happened today we all enjoyed a break from the usual routine with some styrofoam cups and a birthday party! Everyone decorated styrofoam cups last night and we placed them into a mesh bag which was added to the winch wire for the Haps core. Since the core went to 3000 meters, the pressure on the cups was tremendous. Think of how your ears feel when you dive to the bottom of a ten-foot deep swimming pool and you can appreciate what happened to the cups! When the cups came back to the surface, they had been reduced to about one inch tall. Most retained their shape, but some were twisted into bizarre patterns by the pressure. While everyone was picking over the cups to find their own, we all enjoyed birthday cake and ice cream sandwiches in celebration of all those on board who had birthdays in July and August. By the time we had finished, we were at our new station and work began again.
Contact the TEA in the field at . If you cannot connect through your browser, copy the TEA's e-mail address in the "To:" line of your favorite e-mail package. |