23 June, 2001
Saturday
What a treat. We spent most of the morning at CMDL (Climate Monitoring and
Diagnostic Lab), which we pass by every day when we walk to the site. CMDL
is one of four NOAA labs, all of which are constantly monitoring and
sampling the atmosphere. If you want to know anything about greenhouse
gases, climate change, ozone layer or CO2 changes in the atmosphere this is
the place to visit. The other three monitoring sites are in Hawaii, Samoa
and at the South Pole
Two people, Dan Endres, the station chief, and Glen McConville who is the
science technician, staff the Barrow station. Dan has been at the Barrow
station for many years while Glen has been in Barrow for the past year.
Previous to here, Glen spent a year at the South Pole Station and a year at
the station in Samoa; both are extremely knowledgeable about the workings
and functioning of the lab. An interesting aside I found out while I was
there concerns the famous Mauna Loa graph of climate change, which is in
most textbooks and publications. There is other companion data collected
at the same time from each of the other three NOAA sites but this data is
not usually included in posters or publications. Turns out the remaining
three stations also were taking data during that same time period and all 4
graphs follow the same climate change curve. I asked Dan why the other
data wasnít included and he wasnít sure but he said that Barrowís climate
data pre-dated Mauna Loaís by a few years. Since Charles Keeling did his
work at Mauna Loa and was the researcher most associated with getting the
word out on climate change Iím assuming that is why the Hawaii graph is
usually used.
It is surprising how many instruments are housed at CMDL. The building
itself is small, maybe 1,000 sq ft., with 4 rooms. The main instrument
room is insulated with blue, honeycomb patterned, sponge material to cut
down on the noise of the electronic equipment. There is Dan and Glenís
desks in another room a smaller room with a few instraments but looks more
like a workroom for equipment repair and the store room/entry way.
Glen gave us a tour explaining each instrument to us,( Glen, Michelle and
I). Pictures with explanations are below. Nothing up here is secret and
the lab does house equipment for researchers other than NOAA scientists,
they just have to fill out paperwork and get an OK to place anything in the
lab.
Anytime you come across a NOAA graph concerning atmospheric data most
likely it will be from data collected at one, if not all, of these sites.
CMDL:
http://www.cmdl.noaa.gov
The Barrow station:
http://www.cmdl.noaa.gov/brw/
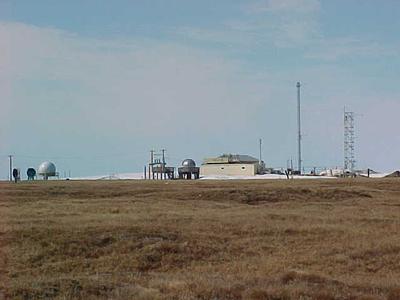
Climate Monitoring and Diagnostic Lab (CMDL) here in Barrow, one of 4 NOAA stations which constantly monitors the atmosphere.
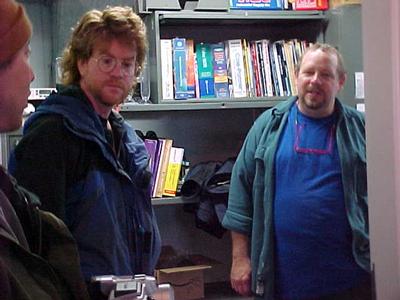
Glen on left and Dan on right (with Glen from SDSU in far left ) at CMDL. They know the San Diego team well and always look forward to them coming up to Barrow in the summer.
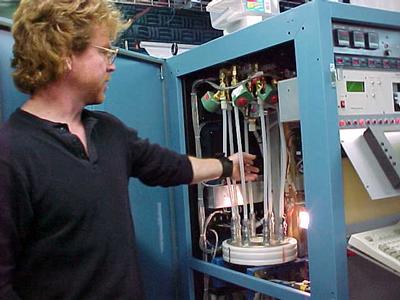
This piece of equiptment measures the types and amounts of specific nitrogen containing aerosols in the air.
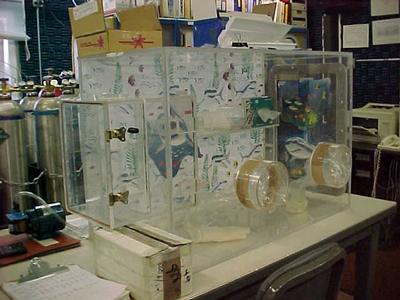
The filters from the above instrument have to be changed in the "fish tank". The filters can pick up NH4 even from your breath so an enclosed area has to be used to change them. You can tell the winters are long and dark up here by the way the fish tank is decorated!
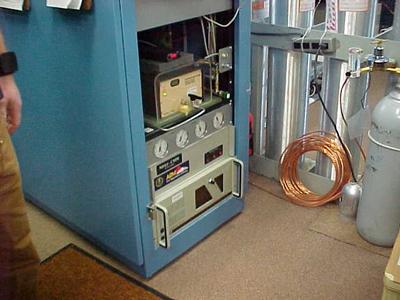
Located under this is the Condensation Nuclei Counter. This measures aerosols found in the air.
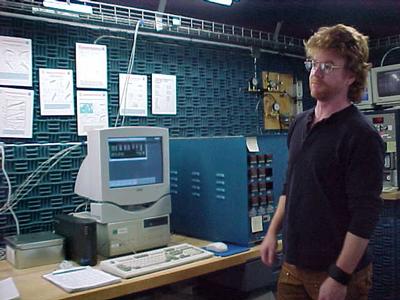
Gases such as CO2 and CFC are measured by this the Gas Chromatograph. Above on the wall (notice the blue, spongy insulation)are some of the latest graphs which have been generated showing CO2 levels rising and CFC levels declining.
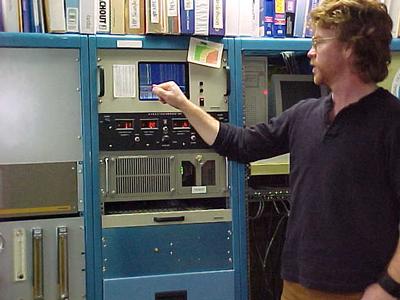
The meteorology tower records such things as temperature, wind speed, pressure, direction, and humidity. This is hooked up to instruments located on the tower outside. This past May was the coldest month on record and last July was the wettest month on record. It is thought that changes in climate will be first detected in the arctic regions and therefore that is why it is important to have stations located in these areas.
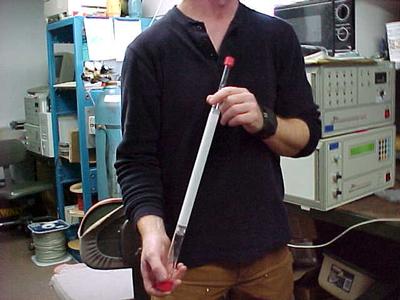
Glen is holding a specially made tube which can be heated to 500 degrees C. He uses these in the mercury collection project he is conducting for his masters degree. To the right are the computer analysers for his research. Behind Glen are more computers. These belong to the research group I'm with from SDSU and are monitoring carbon fluxes.
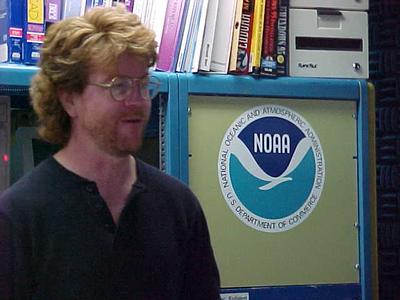
An advertisement thrown in for NOAA who puts multi-millions of dollars every year into climate monitoring and research.
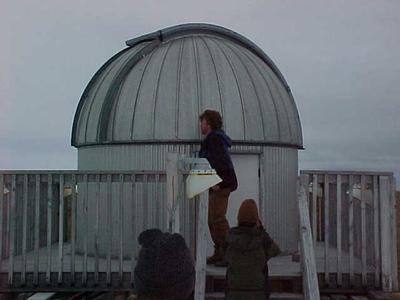
Behind the lab is the Dobson Dome which houses the unit which measures ozone. Glen takes readings at least 3 times per day and more if he can. The dome is heated because of the Dobson unit and its delicate electronics. The dome is opened when measurements are being taken.
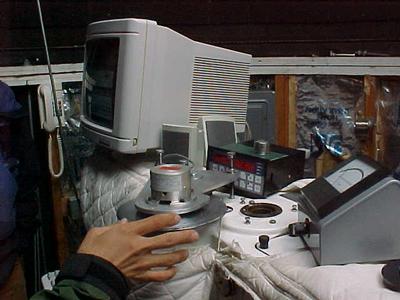
Glen, practicing taking measurements on the Dobson instrument. Here he is manipulating the R dial. You have to balance this disc between two numbers (meter to right) while the unit is collecting data. The dome is heated but notice the instruments are wrapped in blankets also.
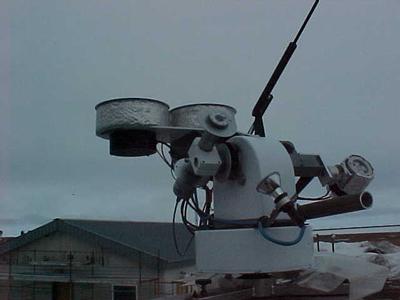
On the roof there are more instruments! This is the All Sky Camera which measures the daily cloud cover.
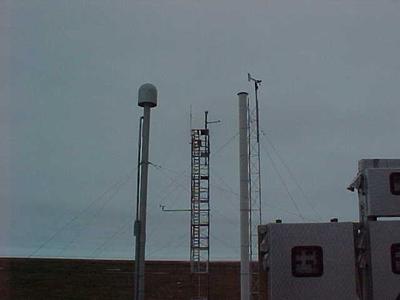
The outside towers which do the weather collecting. On the right are the mercury collection boxes which are connected to the computers downstairs in the lab
Contact the TEA in the field at
.
If you cannot connect through your browser, copy the
TEA's e-mail address in the "To:" line of
your favorite e-mail package.
|
