
|
|
18 July, 2001
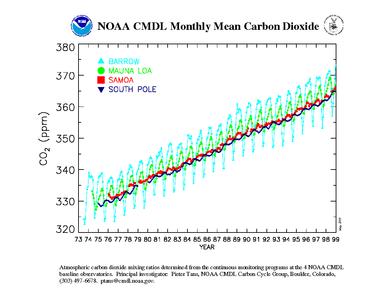
Most people, when talking or studying climate change, refer to this graph. It's in every text book written but in a abbreviated version. Take a closer look at this graph, it displays the complete data set of CO2 recorded in 4 locations. Data from Barrow appears and has a greater fluctuation than that of Mauna Loa or the other two locations. Barrow's data base also goes back a few years previous to all the others.
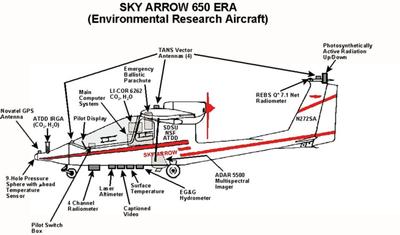
The Sky Arrow and all its instrumentation.
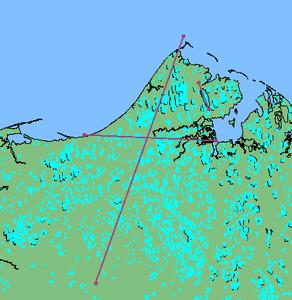
A schematic of the transect Rommel flies in the Sky Arrow from north (Barrow) to 70 miles south (Atkasook) collecting carbon flux data.
Contact the TEA in the field at
.
If you cannot connect through your browser, copy the
TEA's e-mail address in the "To:" line of
your favorite e-mail package.
|