
|
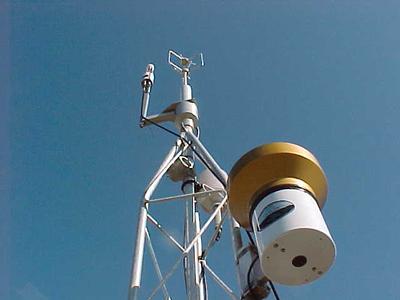
3 July, 2001Tuesday Tower Day http://www.sci.sds u.edu/GCRG/BarrowAxis/barrowcam.html To get a live picture of the Barrow tower, updated every 15 minutes, visit the above site. Not much action going on but it does furnish you a way to see what the present weather is in Barrow! I have been working with Glen at his site specifically but there are two other people, Hyojung and Rommel, who also have sites of differing sizes and areas that are involved with the project as a whole. Hyojung Kwon is working with three Eddy Covariance Towers one of which is here in Barrow. Glen's site lies at the outer edge of one of the 400 meter transects N.W. of the tower. The 2nd tower is in Atkasook, 60 km. south of here and the 3rd is in Prudhoe Bay, about 70 km east of Barrow. This is where the oil fields on the North Slope are located. Glen's site and project is really a part of the entire project that SDSU is running up here dealing with climate change and its' effects. While his project can and does function independently he is able to validate the accuracy of his data by comparing it to the tower's data and in this way they act as checks on each other. This gives both Glen and Hyojung ways to check the accuracy of their data The towers also provide data over a larger temporal and special area. This is necessary to generalize what is happening at the different sites. The area covered by the tower consists of a 400meter radius as compared to Glen's 20 by 40 meter site. Collecting data over the larger area expands the project's ability to see what is happening over a large area, which is made up of more of the different vegetative types and geographic factors effecting wind speeds and directions. These towers, called Eddy Covariance Towers operate 24 hours a day collecting measurements on wind speed and direction, temperature, relative humidity and CO2/ water vapor concentration and solar radiation budgets. Hyojung's research involves collecting and analyzing the data from the various towers and keeping them operating. This seems to be an elusive goal this season. On her arrival here three weeks ago, she found the Atkasook tower had problems and was down and then the Prudhoe Bay tower lost power and stopped working. With plane trips to each location, remember Barrow is isolated with no roads connecting the villages; the problems take a while to fix. She and Spring, who is now helping Hyojung exclusively, have visited Atkasook twice and plan on returning next week with hopes of getting the tower operating again. Tomorrow they leave for Prudhoe Bay to establish power back there. Many air miles later the towers look like they will all be operating once again and that is good news for everyone. The Barrow tower has been working fine but with the others out Hyojung finds her time split between the other locations and it creates difficulties. Every minute the towers are down means data is not being collected and this affects Hyojung's research. The towers provide a regional scale to the investigation determining net carbon flux and energy balance of the Arctic ecosystem. With towers, a regional understanding of the workings of the tundra gas exchanges system can be followed on a continuous, 24 hour a day, time scale. The picture of the tower below shows the different instruments that are mounted on it. Starting from the top is the Sonic Anemometer-Thermometer. This measures the vertical and horizontal velocity and directions of the wind along with temperature. Next, down and to the left, is the IRGA (Infa-red Gas Analyzer), which detects CO2 and water vapor concentrations in the air as the air passes over its sensors. A soil temperature profile is taken at surface level and then 5 and 10 cm below ground. All of the various measurements are recalculated to each other by the data logger that is located in the larger white instrument box located at eye level at the bottom of the tower. Hence the name Eddy Covariance Tower. Covariance means the comparing of 2 variables, in this case the CO2 and H2O vapor concentrations and collating them to the wind movements. All the data is fed into the computer located 200 meters away inside CMDL. The tower is visited daily while we are up here, mainly to clean the instruments and to make sure all is operating correctly. During the winter (and summer also) the data is simultaneously displayed in the lab at San Diego State also.
Contact the TEA in the field at . If you cannot connect through your browser, copy the TEA's e-mail address in the "To:" line of your favorite e-mail package. |