
|
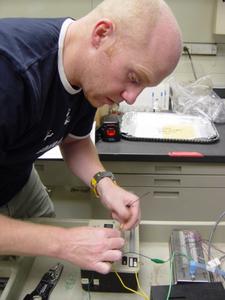
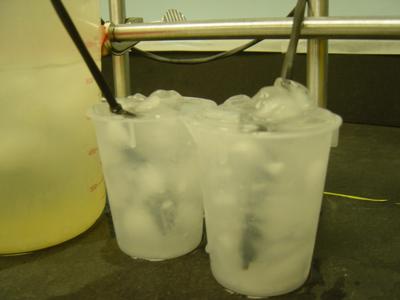
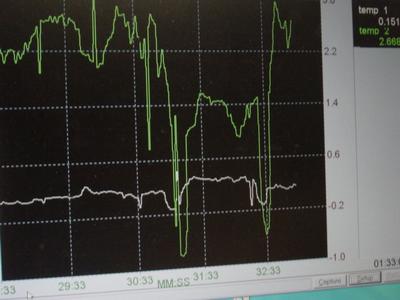
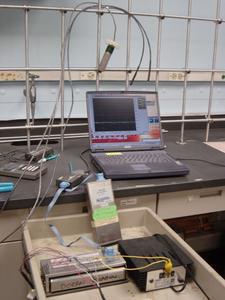
5 August, 2003When problem solving . . . do not forget to look for the obvious! First thing this morning, Phil gave me a tour of the freezer facility where the cores from Antarctica are stored. The walk in freezer is kept at -20° C. Although this may be a bit colder than the typical summer McMurdo Dry Valley temperature, it was comforting to remember that while in Antarctica, plenty of extreme cold weather clothing will be issued! After the freezer tour, we got back to work on the "21X" datalogger, which had successfully run the program we installed yesterday throughout the night. We retrieved all the data and were poised for our next assignment. Phil and I "graduated" from the "21X" to the "CR10" Campbell Scientific datalogger. We were given three probes; two measured only temperature, while the third measured both temperature and relative humidity. Our task was to hook up the two temperature probes so that one measured in degrees Celsius and the other measured in degrees Fahrenheit. The remaining probe would measure degrees Celsius and relative humidity. We needed to program the system so that each probe would take a reading every two seconds, the averages of each probe would be calculated every five minutes, and the data would be sent to the storage module every fifteen minutes. While setting up the system, we noticed some fluctuations between the two plain temperature probes. We wanted to trace the problem to see if the disparity was due to a faulty probe, faulty programming, or a faulty connection to the datalogger. The connections and programming seemed in order, so we set up an ice water bath for each probe to test their accuracy; both probes should register a "freezing" temperature if functioning properly. We discovered a faulty probe, labeled it as inaccurate so anyone using it in the future would know it was defective. It would, however, work for our purposes, so we continued with the programming. Once the system was up and running, we asked the computer to display a "real time" graph of the data being collected. To our dismay, only two data sets were being shown where there should have been four (three for temperature and one for relative humidity). This discrepancy lead to a problem-solving marathon. We checked and rechecked everything. We disassembled and reassembled the system. We even rewrote the program, but still could only view two data sets on the graph display. After considerable effort, Peter came in to assist us with the problem. With the simple click of a button, the graph started showing all four data sets. We had it set up correctly all along - we simply had not told the graph to show us all four data sets; we had only asked it to show us two! From now on we will not forget to check the obvious when problems arise!
Contact the TEA in the field at . If you cannot connect through your browser, copy the TEA's e-mail address in the "To:" line of your favorite e-mail package. |