
|
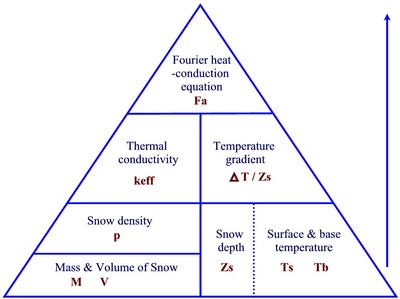
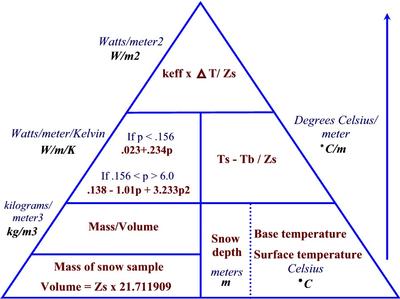
5 April, 2002Weather: Partly Cloudy Using surface temperature, snow depth, and ice thickness data, what do you think will happen to the snow and ice on Jalpertia pond within the next two weeks? Tsurf ------ Snow depth ------- Ice Thickness March 2 -4.4 ëC -------- 30.4 cm ---------- 76.6 cm March 9 -7.5 ëC -------- 29.4 cm ---------- 78.5 cm March 16 -0.07 ëC ------- 27.1 cm ---------- 77.3 cm March 23 -3.2 ëC -------- 26.1 cm ---------- 82.0 cm March 30 -13.3 ëC ------- 27.5 cm ---------- 79.3 cm The Science Behind Conductive Heat Flux (Heat Flow) Well, you're about to become snow and ice experts and we're now on the last phase of heat flow calculations. To this point, we've talked about thermal conductivity using snow density values from snow samples and temperature gradient using base and surface temperatures and snow depth. Remember, there are two functions of heat flow: thermal conductivity and temperature gradient. Once we've calculated those two functions, all we need to do is multiply the two final values to determine heat flow. Not bad, huh? See the Heat Flow Chart below for conductive heat flux calculation procedures. So, What Do You Think? What are some factors that will influence heat flux? Hint: How would the depth of snow affect heat flux? See tomorrow for some examples and explanation.
Contact the TEA in the field at . If you cannot connect through your browser, copy the TEA's e-mail address in the "To:" line of your favorite e-mail package. |