
|
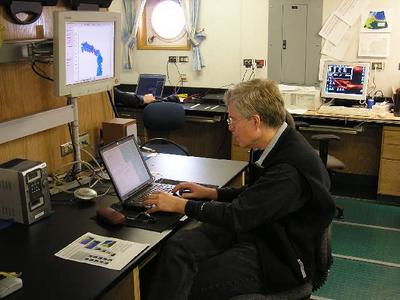
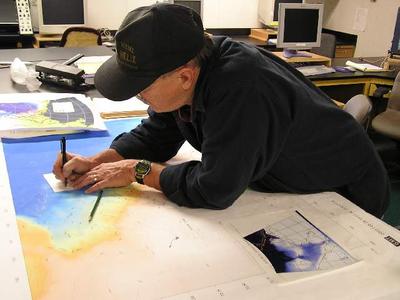
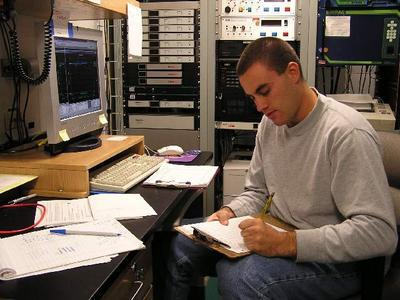
25 July, 2003One of the advantages that these little lap top computers offer is the ability for scientists to quickly analyze and assess the data while it is being collected during the cruise. Not long ago, oceanographers painstakingly plotted each location by hand, labeled the values that were being measured, and then, rather crudely sketch the contours that connected the numerous data points to get a handle on what they were seeing. This was often done weeks - if not months - later after the cruise was over. Nowadays, of course, with a few simple clicks on the desired variables, figures, graphs, and maps can be generated almost instantly. This is a tremendous benefit, of course, to scientists since they can use this information readily at hand to modify plans that will enable them to better attain the program's goals. It's also exciting to see our efforts bear some fruit while we are hard at it out at sea. One early finding, for example, are some unique features in the water columns of several sections (i.e. lines of stations) that we recently completed across Barrow Canyon. We have detected layers of relatively low and relatively high-oxygenated waters from approximately 50-120 meters deep in an underwater canyon trending in a southeast to northwest direction offshore of Barrow. According to Chief Scientist, Jim Swift, " . . .these were first noticed in the CTD oxygen probe data, but their characteristics show up in nearly all of our measurements." These narrow bands of sea water, he goes on to say, "seem to be shelf-water outflows pouring into the upper reaches of Barrow Canyon and subsequently draining into the Arctic Ocean through Barrow Canyon. Our remaining Chukchi shelf stations will hopefully show us the source region for these outflows of water." Jim's guessing that this will be found in a slight depression in the shelf to the southwest of the canyon. Another example of quick-access data resulted in the observation of two distinct eddies in the water along our most recent section of stations. This may represent an outflow from another underwater canyon further to the west of our present location. The really cool thing is this: the computers on board will permit Jim to do a quick analysis of the data with just a few clicks of the appropriate buttons to either confirm or reject this idea. It's time to go as another rosette cast is on its way up with more CTD data, water samples, and maybe, some answers to our questions.
Contact the TEA in the field at . If you cannot connect through your browser, copy the TEA's e-mail address in the "To:" line of your favorite e-mail package. |