22 July, 2001
Just how warm is it, anyway? and Analyzing data
6:00 p.m.
The sky was cloudy this morning and threatening to rain. We decided to take
our chances and headed up the glacier to collect seismic reflection data.
Fortunately, the rain skirted the Matanuska Valley and the sun burned through
the mist by noon, warming us and the glacier.
Life on ice ... (almost)
Pat Burkhart left today. His constant good cheer, wisdom and odd camp
fashion statements will be missed.
After helping lug equipment up to the data collection site, the REU students,
Jeff and Nelson took Pat to the airport (and used the trip to Anchorage as an
excuse to go shopping and eat a meal they didn't have to clean up after)
*****
As I was walking up the glacier today, I was struck by the coolness of heat
energy. Examples of its coolness are easy to come by on and near the glacier.
(1) Our sleeping bags stuffed with goose feathers (or other materials) that
trap air. When our bodies heat up inside the sleeping bag, the trapped air
insulates us from the cold night.
(2) Many of our sleeping bags have built-in hoods. The hoods trap the body
heat that our bodies send to our heads to keep our brains warm.
(3) We wear layers of clothing, trapping air between layers and warming up
as the rate at which our bodies radiate heat to the outside air slows down.
(4) If tents are closed too tightly, the vapor from our breath will
condense (turn from gas to liquid) on the insides of our tents, making
puddles that can get our clothes and sleeping bags wet.
(5) The ablation (melting) rates on the glacier are amazing. On the
hike to the site today, we ran across a 40-foot wire coiled on the surface of
the glacier. Jeff and Greg recalled that two years ago, this wire was put in
a hole straight down in the ice. The folks at CRREL have stakes set up
around glacier and measure the rate at which different spots on glacier melt
everyday: a drop of several inches per day is not unusual! As you might
expect, on sunny days, the glacier melts more rapidly than on cloudy days.
(6) If the sun is hidden behind clouds, a cool wind whips down the glacier,
sucking heat from warm bodies standing on it. If clouds are gone, the wind
may come from the valley, bringing warm air with it.
(7) Some of the most fascinating examples of heat energy are found at the
surface of the ice. Sediment from landslides up glacier end up scattered on
the glacier. Some very cool things can happen with that sediment, depending
on the concentration and size of sediment.
(a) Big stones can end up sitting on ice pedastals:
Boulders block the sun from reaching the ice. When the ice around the
boulder melts, the boulder is left on a column of ice. Eventually, the base
of the column melts and the stone falls, blocking another patch of ice. The
process is repeated. In this way, the boulders work their way down the
glacier. (Check out Marvin Giesting's TEArctic 2000 journals for more
information about this!)
(b) Small stones can melt holes in the ice:
Smaller stones sitting by themselves absorb the sun's energy and melt the ice
beneath them, creating pools of ice whose outlines match the outline of the
stone. Some of the pools can be quite deep (about 0.5 m) It has been very
hard to capture these small pools successfully on film. (Though I have tried
several times.... These little pools are VERY cool!) The water that fills in
over the stones is extremely clear.
(c) Small bits of sediment can form cones of sediment
Scattered over the glacier are cone-shaped piles of sediment. The size of
the piles can range from several cm to several m high. It turns out that
when the sediment reaches a certain thickness (about a cm or more) and is
found in certain concentration, it acts like an insulator. When the ice
around the sediment melts, a cone starts to form. Over time, the cones can
grow to be quite large and quite steep.
I'll include a picture later.
Amazing stuff!
Science at work
Analyzing the data received from ground-petrating radar and seismic
reflections takes a careful eye and thoughtful manipulation. Even as I
write, Greg is processing the data we collected today. He has saved pictures
of each step in the analysis process. You will find those pictures below,
along with the Greg's reason for each step.
Cheers.
~SM
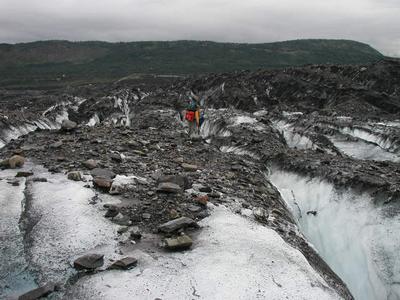
Kendra and Greg are scouting the easiest route across the crevasse.
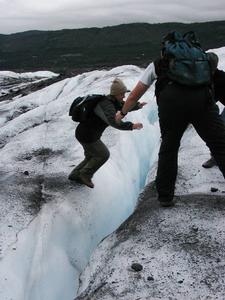
Andrea leaps across the crevasse.
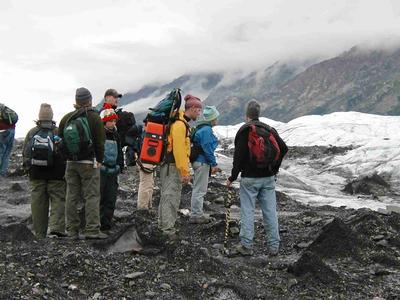
Our next data collection site was about 2 miles up glacier.
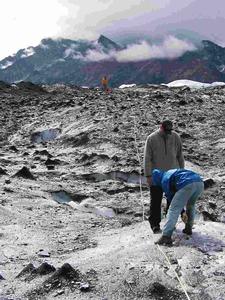
Kendra is creating seismic waves.
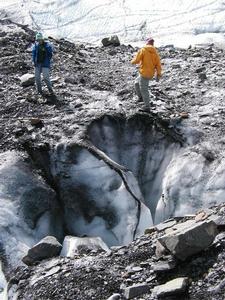
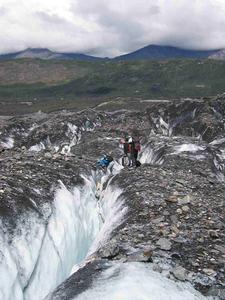
Greg is standing above a VERY deep moulin. We dropped a couple of rocks down the moulin and heard them riccochet against the ice walls for many seconds.
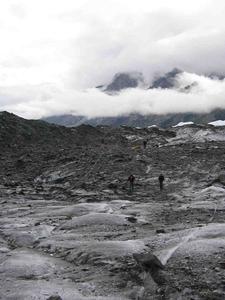
This is where we collected data today.
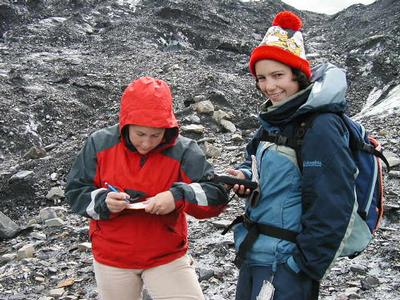
Ranae and Mehgan use a Global Positioning System device to find the exact location of our data collection site.
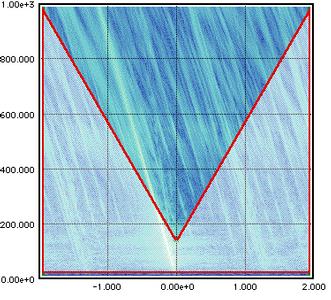
Figure 7: Data to mute Everything in the shaded areas gets muted, or turned down.
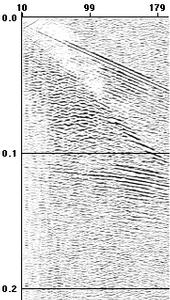
Figure 8: FK filter applied The new little lines bounded by old slope on line of ground roll are processing artifacts. We have gotten rid of the ground roll, but added artifacts. At this point, the data processor (Greg) needs to decide if getting rid of the ground roll is worth adding the artifacts.
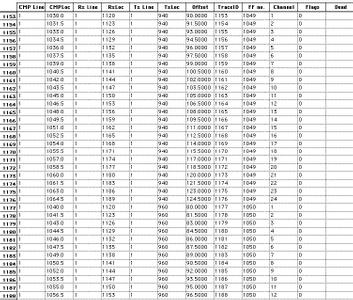
Figure 9: Common mid-point gather When we collected data today, we strung out 24 geophones and hit the sledge hammer in 57 different places. That means that we collected 1368 (24x57 = 1368) different traces. The next step is to sort the data by common mid-points (the point half way point between source and receiver). It is abbreviated CMP in the figure.
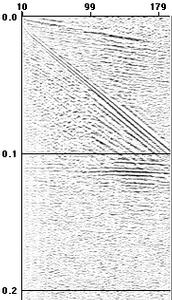
Figure 10: Normal move-out correction (NMO) Because some source-receiver pairs were further apart, this step in the process is necessary to correct for longer travel time from more distant sources and receivers as we try to compare common mid-point data. This step requires some trial and error.

Figure 11: Add the traces for one point in the subsurface Mute(turn volume off) information above the reflection, as we are not interested in this data for our project (Note: we could have done this step earlier in the data processing though waiting is often a good idea to ensure that surprising data is not overlooked.) Take all traces for one common-midpoint on the subsurface and add them together. Random noise tends to cancel out random noise, while coherent reflections tend to build on each other. Notice that this step also reduces ground roll.
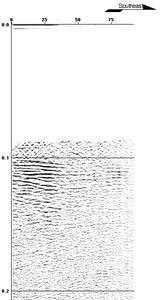
Figure 12: Final product Show the added common-midpoint data next to each other. Above 0.1 s is likely noise Below 0.1 s is likely the base of the glacier, calculated to be 210 m deep!=20= =20 (Now, wasn't that easier than drilling a hole 600 feet deep!) Layers beneath base are probably outwash (It has the same reflection=20 character as data collected on an outwash plain=E2=80=A6 on the runway aroun= d the=20 corner from the camp, actually)
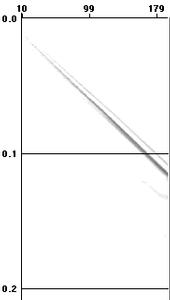
Figure 1: Raw data This is the raw data. All you see is the loudest noise, in this case, "surface waves": slow, large waves roll along the surface of the ground (e.g., a drop of water creating waves on a puddle) The horizontal axis is distance (m) and the vertical axis is time (s). (Further to the right is further away, further down is a longer time away.)
This is extreme geophysics!
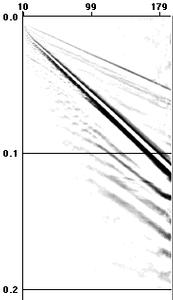
Figure 2: "Scaling" the data (a little) By turning up the "volume", more information becomes apparent.
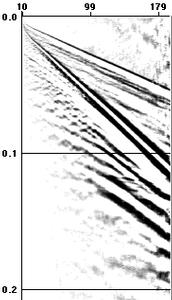
Figure 3: Scaling even more More information is apparent. The top line is the direct P wave (pressure wave travelling directly=20 through the ground from the source to the receiver). It arrives at each of=20 geophones most quickly. The smeared lines just beneath the direct P wave are probably reflections=20 from within ice near the surface. The surface waves (also known as "ground roll") are very strong. Ground rol= l=20 in ice travels faster than sound in air, and can be heard!! (Greg commented= =20 that he could hear each hammer blow 2-3 times: once for the ground roll, onc= e=20 for the sound wave, and occasionally an echo). The curved lines at the bottom are probably reflections, but most potential=20 reflections are proably still masked by the=E2=80=9Clouder=E2=80=9D vibratio= ns from ground=20 roll.
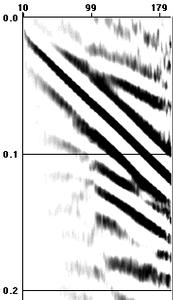
Figure 4: Low-frequency Since the goal of the process is to "enhance signal and reduce noise", it is a good idea to know where the "noise" is. Most noise is low frequency and most signal is high frequency. By filtering out high frequency, we see the data that you will mostly want to NOT have in your final product.
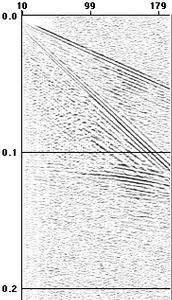
Figure 5: High-frequency Now add the high freqency back in and take out the low frequency. Notice that the ground roll is mostly gone. Again, we are looking for reflections (which, it turns out, are mostly high frequency). In this figure, you can see the curved reflections come in around 0.1 s. The steep line is left-over ground roll, and the not-steep line is the direct wave�
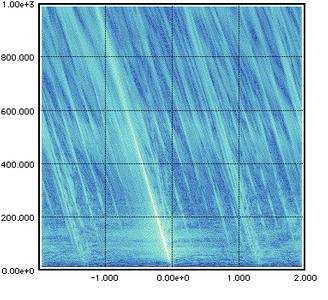
Figure 6: FK diagram Goal of rest of processing is to look at reflections without looking at other stuff. We need to find and process out unwanted frequencies. One tool to help with this is an FK diagram, which is another way to display the raw data. The bright streak coming out of "0 wave number: is ground roll Processing data this way allows you to get rid parcticular slope (for example, when reflections and ground roll arrived at geophones at the same time)
Contact the TEA in the field at
.
If you cannot connect through your browser, copy the
TEA's e-mail address in the "To:" line of
your favorite e-mail package.
|
