17 November, 1999
Data from the Ice...that's nice!
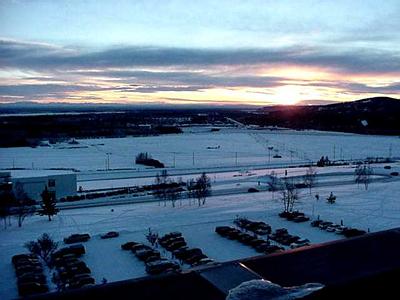
The Geophysical Institute is perched atop a small hill, allowing for a
fantastic view of Fairbanks (see photo). As I hike across campus, my mind
is deceived by the lack of light. The flurry of activity around and inside
the G.I. reminds me that it's close to 9AM already, and that "sunrise" is
still a while away. I stop to think about my friends and family back in CT
who are four hours further into their day.
I am feeling a little nervous about what I need to accomplish today. I am
unfamiliar with the Sigma Plot software and have never calculated "heat
fluxes" before! What's worse, I'm working on a Mac rather than a PC.
Yikes!! Luckily for me, Martin (Dr. Jeffries) and Kim (an experienced
research technician) are both patient AND knowledgeable!
As the day progresses I realize that, not only am I catching on, but I also
LIKE what I'm doing. Once the data are organized, they begin to tell a
story. Recognizing and explaining the patterns that we see will be the fun
part!
Heat Flux, as you know from yesterday's work, is a function of three things:
- 1. temperature gradient between the snow surface and the ice surface
- 2. snow depth, and
- 3. thermal conductivity (calculated from equations that consider snow
density)
FLUX = (temp. gradient/depth)(thermal conductivity)
By the end of next week I will make some data available so that you can
practice making the calculations and understanding the patterns yourself!

Sunset in Fairbanks: 3:30 PM

Entering data into Sigma Plot
Contact the TEA in the field at
.
If you cannot connect through your browser, copy the
TEA's e-mail address in the "To:" line of
your favorite e-mail package.
|
