
|
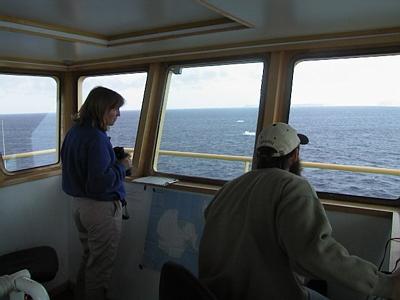
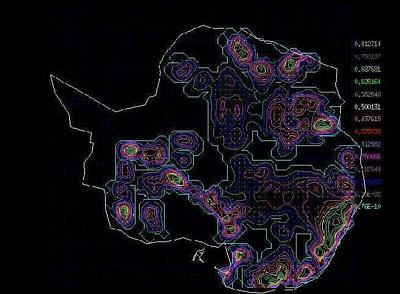
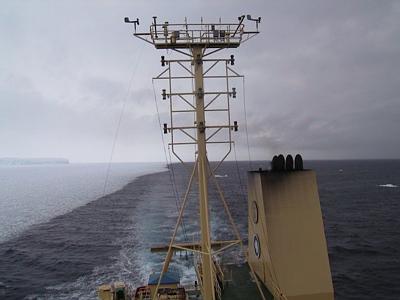
16 March, 2000Antarctica, South Dakota, Malawi and Computers 74 25 s, 105 42 w East of Thwaites Glacier Tongue, northwest of Pine Island Bay Depth 692 m (2270 ft.) Temp 3 C (27 F) and dropping Winds southeast 30 knots (35 mph) gusting to 35 knots (40 mph) Barometer 982 mb, dropping rapidly, high of 990 mb 4 hours ago. For at least the last week, skies have been cloudy in this sector of Antarctica, so we have not been able to get visual satellite ice images to plan our exploration. We have passive and active microwave images, but each has its problems for ship navigation. Passive ones don't have sufficient resolution; the smallest details they show are tens of kilometers across. Active ones are very detailed (remember the image of Thwaites Glacier Tongue in a former journal entry), but it is difficult to interpret them. Icebergs stand out and are easy to identify, but it is hard to tell what sort of surface is between the bergs. It is easy to confuse rough open water with snow covered multi-year ice. Without current visual ice images, we try to guess at where and how thick the sea ice is around us. We figured that the strong east winds of yesterday would blow ice to the western edge of the large bay we are in. The thick pack ice that gave us so much trouble last night in the western edges had to blow in from somewhere. So we were not completely surprised, but we were happy yesterday afternoon when we came upon a large area of open water to the east of the Thwaites Glacier Tongue and to the northwest of Pine Island Bay. We've been cruising in it ever since. Cruising in this polyna (ice-free area) is not productive for the seal people, because there is no pack ice for the seals to haul out on. For a while we followed the fast ice edge and they saw an occasional animal, but their total count for the day was less than twenty. They saw no whales. If it disappoints Sue and Brad, the open water is gold for Tom Kellogg. We have been cruising in a grid pattern, and using the SeaBeam imager to draw a map of the deep bedrock sea floor below us. The lack of ice means not only better quality images and reduced ping editing, but also that we can move faster and image more bottom. The pictures of the deep glacial troughs are exciting, worlds never seen by human eyes. I've been watching the computer output screen. As we move, blank white areas are painted in colored contours, representing the hills and valleys far below us. It's fascinating. We've been at sea over a month now, working twelve hour watches seven days a week. My watch is midnight to noon, so I spend a lot of time working together with a few people. One of these, another "core person" is Jesse Johnson, a graduate student at the University of Maine. If all goes as planned, Jesse will soon be married and have a Ph.D. Since we were imaging the bottom last night, we didn't take cores, and had time to talk about his life and his thesis work. Both are interesting. I asked him what led to his being on the Nathaniel B. Palmer in the Amundsen Sea. Jesse was brought up in Yankton, South Dakota. He has always enjoyed math, science, and especially computers. He remembers writing simple programs to generate crossword puzzles, and to determine the molecular weight of a compound from its chemical formula. He didn't always do well in high school. "I was not that serious a scholar," he says. However, he did well in Chemistry. He remembers his Chemistry teacher, Mr. Bob Medic, as an inspiration. In his senior year he took a college level physics course, and was hooked. He left South Dakota to become an undergraduate at the University of Minnesota. He spent five years there, graduating with a major in Physics and minors in Mathematics and Chemistry. While an undergraduate, he had interesting work experience with an environmental engineering company. His company was working on an EPA Superfund pollution site near the University. Years before, a railroad tie manufacturer had occupied the land. The company had used creosote and insecticides to treat the track sleepers. When the company went out of business, the land passed through several hands to a developer, who buried debris in preparation for building housing. "There was nothing noticeable on the surface," Jesse says, "but when you dug down a few feet you smelled strong chemical odors." His company's solution for the problem involved leaching the area with oxygen rich water, and culturing the few microorganisms that would break down the pollutants. After graduating, Jesse, with an urge for adventure, joined the Peace Corps. He was sent to Malawi to teach math and science. He remembers that he sometimes had 100 students in a class. He completed his two year assignment, and then stayed on another year to manage a computer supply and consulting firm in the country. Later he returned to the US. It was as an undergraduate that he became interested in computer modeling. These models simulate real life processes using computers, to simplify and predict these processes. It's a natural blend of math and computer science. This interest led him to graduate school at the University of Maine, where he is using his skills on a computer model of the entire Antarctic ice cap. He'd like to describe the present state of the ice, and help predict what will happen in the future. What is a mathematical or computer model? Think of it this way. Supposing an aircraft designer wants to design and build a new airliner. One way to do it would be to draw up some plans, and then build the new plane and try it. But supposing there was a problem with the design, for example supposing it wasn't very fuel efficient, or had dangerous flight characteristics. The company would have spent a great deal of money to find this out. To avoid the risk, a company could build small models, and test them in a wind tunnel. This would save a lot of money, but even wind tunnel models are expensive and take time to build. The solution to the problem is a computer model. If the designer could describe the airplane and its movement through the air as a series of mathematical equations, she or he could test it, then change and retest it at very little expense. With the speed and versatility of modern computers, the designer could test thousands of airplanes in the time it took to manufacture and fly a single real one. Of course wind tunnel models and a full size test plane would still have to be built. The computer model is only as good as the skill of the engineer can make it, but the full size model would be much more likely to succeed. The mathematical model describes and predicts what the real airplane does. Jesse is working to improve a model that his adviser, Dr. James Fasthook has been working on for a decade or more. The model attempts to describe what is actually here, the vast ice sheet several kilometers thick, moving and flowing slowly down hill and into the surrounding ocean. There is a value to that, in that it helps researchers guess where to concentrate their investigations. But what is more important is that the model can be run ahead in time, and make predictions about what will happen to the ice sheet hundreds or thousands of years in the future. For example, Jesse can enter different values for snow input, and let the model go ahead in time. At a certain value, the model shows the ice sheet disintegrating completely. The model also predicts such things as the position and speed of fast moving glaciers, which turn out to be in the places where these features are actually observed. If the model successfully describes what is actually observed now, then chances are that it will be accurate in its prediction of future changes. Of course the only way to know for sure is to wait and see, but a properly designed model can show us what is very likely to happen. Jesse's model doesn't take a large and specialized computer to run. His laptop computer, using the Unix operating system, does quite well. I've watched him enter some initial conditions, and then let the computer calculate image after image of the size and thickness of the ice cap in the future. For example, if he inputs summer time average temperatures above 10 C (50 F), the model ice sheet breaks up, melts and disappears. Looking out my cabin porthole, it is hard to imagine that this place could ever warm up. It's so big and so cold. But there hasn't always been an icecap on Antarctica; sometime in the future, trees will grow here as they once did. I don't expect I'll live to see it.
Contact the TEA in the field at . If you cannot connect through your browser, copy the TEA's e-mail address in the "To:" line of your favorite e-mail package. |