|
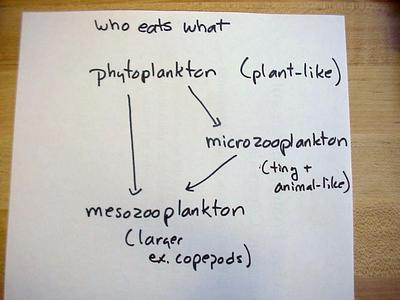
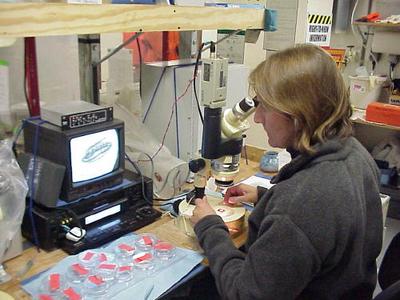
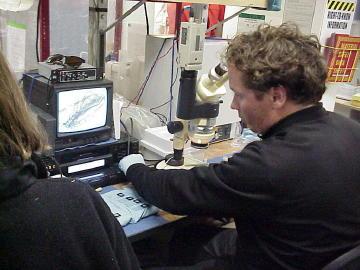
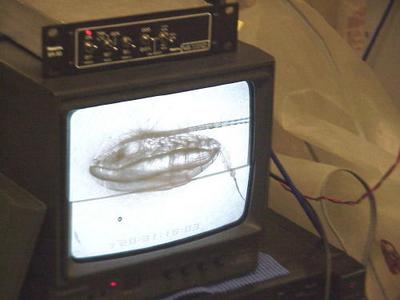
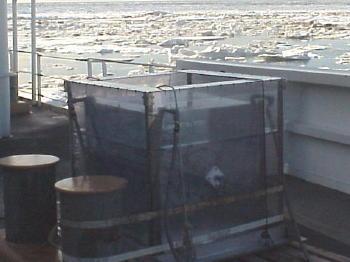
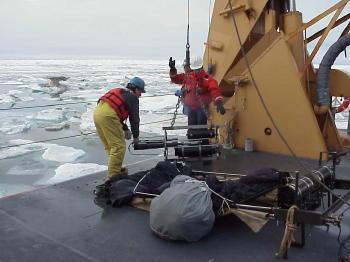
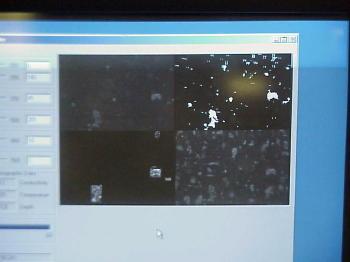
28 July, 2002When we’re at the deep stations, days and nights really run together. We started our Haps core work around 2:00 this morning, but others put the core in, and I didn’t have to be on deck until 4 when the first one came out. By the time we finished it was 7:45 and time for breakfast. Every time we put down the Haps core at this depth and then have to wait for it to come back up, I remind myself that it is going down nearly two miles to the bottom of the ocean before it starts back up! During the day today we moved to our next deep station. We’re again at 3000 meters and, because we arrived a bit later in the day, I can plan to have a bit of time off before I go to work again tomorrow. If you check the ship’s cruise path at the JOSS website at http://www.joss.ucar.edu/sbi/catalog, you’ll see that we are in East Barrow Canyon, an area of the Beaufort Sea north and east of Point Barrow, Alaska. Point Barrow is the northernmost point in the United States at a latitude of 71 degrees north. By early August, the sun will actually set in Barrow and, by the end of our cruise, we’ll see some actual darkness during the night time hours. There are several people on board studying plankton (organisms that drift in the water), both zooplankton (animals) and phytoplankton (plants). Carin Ashjian, an associate scientist at the Woods Hole Oceanographic Institute (WHOI) and Stephane Plourde, a post doc from WHOI, are both working with zooplankton. One of the two studies they are doing on board is a study of the grazing (eating) and egg production rates of dominant copepods. A copepod is a large type of zooplankton (see the picture below) somewhat like a shrimp. They hope to better understand the ecosystems (how living things fit with each other and with the environment they live in) of the Arctic Ocean shelf and basin, how carbon is processed by the plankton (see the journal from July 26) and how this all affects the transfer of material between the shelf and the basin. Their work is closely tied to other studies done on board. Carin and Stephane study the mesozooplankton, the larger ones, which eat both microzooplankton (micro = small) and the phytoplankton. The microzooplankton also eat the phytoplankton (see the diagram in the photo below). Others are studying the phytoplankton and the microzooplankton. It all fits together! Carin and Stephane start with the water from the CTD cast which contains phytoplankton and microzooplankton. They then use nets that are dropped down and brought up vertically to capture the zooplankton. They take the CTD water, add a known number of copepods (mesozooplankton) to it and incubate it (put it in a natural environment where they can feed) for 24 hours (see photo below). They remove the copepods, count them, and use that information in conjunction with information about phytoplankton and microzooplankton to get an idea of the grazing rate (how much they are eating). If there are lots of phytoplankton around and the copepods can’t eat it all, the phytoplankton will die and sink to the bottom. That adds to the benthos (bottom organisms) that Jackie Grebmeier and others are sampling. (I told you it all fits together!) Carin and Stephane also look for eggs on the copepods as a measure of the potential growth of the population. Early results show that egg production seems to be less in the basin (deep water) than on the shelf, possibly because food is less available in the deeper water. The other work that Carin and Stephane are doing uses an amazing underwater microscope called a video plankton recorder (VPR), an instrument that actually photographs plankton and parcticles with a light that flashes 60 times each second. With this, they can get a picture (it comes up on a screen in the lab) of the organisms at each depth. By combining this data with information about water currents, they can get an idea of how plankton and parcticles move between the shelf and the basin. When combined with data from other researchers, this information will provide a model of how the ecosystem works in these regions. The final goal is to use this model to predict the impact of climate change in this region.
Contact the TEA in the field at . If you cannot connect through your browser, copy the TEA's e-mail address in the "To:" line of your favorite e-mail package. |