25 June, 2000
Sunday, June 25, 2000
Al Roker & Willard Scott Have Nothing on These Guys!
As I mentioned yesterday, the Marine Science Techs, or MSTs make synoptic
(giving a general overview of the whole) weather observations, every three
to six hours. These observations are used to help commercial vessel sea
traffic get to their destination safely. And if something should go wrong
during their sail, the system then can be used to help aid in the safe
recovery of the vessel and its crew.
What makes up synoptic weather data?
A wide range of data is collected every three to six hours. Not only is
weather and sea conditions noted, physical conditions of the ship are also
taken into account. These observations can prove useful to other vessels
presently sailing in the vicinity or those that are developing float plans
for an upcoming trip.
Basic Data
Date
Ship's position
Using a GPS recorder, the ship's latitude and longitude are recorded.
Ship's Quadrant
It is noted whether the ship is east or west of the Prime Meridian, and
north or south of the Equator.
Weather Observations
Present weather conditions
Conditions such a rain showers, thunderstorms, fog, and drizzle are noted.
True wind direction
If the ship is not moving, this can be determined by taking the ships
heading measured in degrees, adding the anemometer reading and subtracting
360 degrees.
(A heading of 360 degrees is due north.)
If the ship is moving, a simple instrument known as a wind computer is used.
This "wind computer" is actually a simple device. It is composed of two
discs.
The bottom disc has 360 degrees marked off around its perimeter.
The top disc is transparent. It has a grid indicating wind speeds. By
plotting a) the ships heading and speed and b) the direction and speed at
which the wind is hitting the ship, a calculation can be made to determine
the winds true wind speed
Picture 11
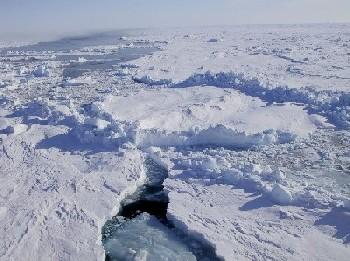
Thick, first year ice. Picture 10 Stage of development of sea ice Examples: new, young, first year (thick or thin), old ice, etc. Bearing of principal ice edge Direction of ice edge.
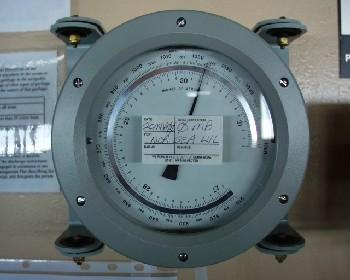
Picture 2 Sea level pressure Measured in millibars using a barometer.
Picture 3
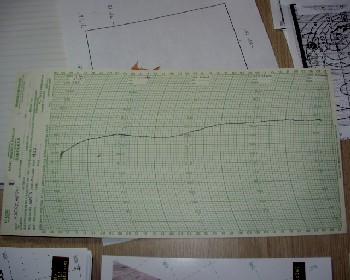
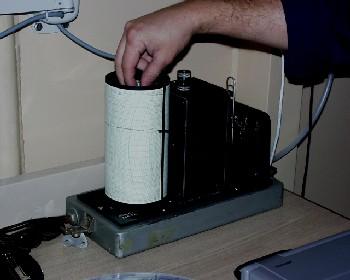
Picture 4 Pictures 3 & 4 Barograph charted reading This barograph, dating back 40 or 50 years, tracks the sea level pressure trend over a 5-day period. It's odd to see such a "low-tech" device in the midst of all the advanced technology on board the Healy.
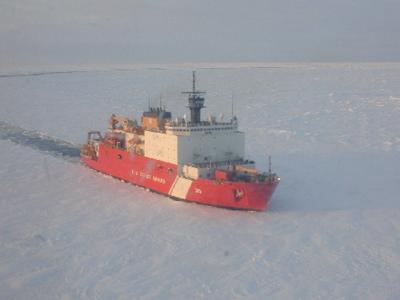
Picture 13 Present ice situation Examples: in ice, in open water, easy ice to penetrate, difficult ice to penetrate, ice under pressure, ship is beset, etc. As you can tell, there are many important factors to take into account when tracking ships for the safety. It is important that vessels sailing the high seas file float plans with the appropriate authorities, keep track of weather conditions, and stay informed of changing oceanographic conditions for their own well being. Doing so may also be of value in helping another vessel in distress.
Picture 6
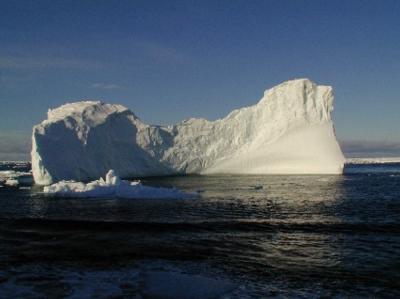
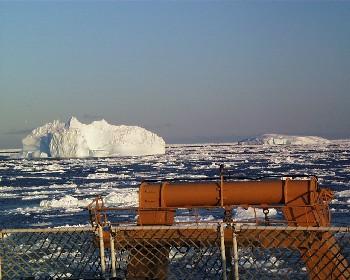
Picture 12 Pictures 11 & 12 Ice of land origin The number of icebergs and the presence of growlers or bergy bits is noted.
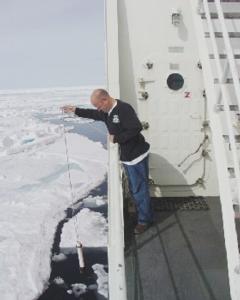
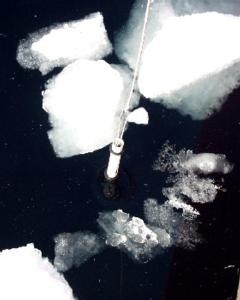
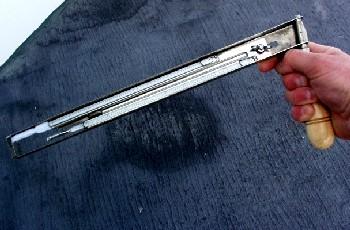
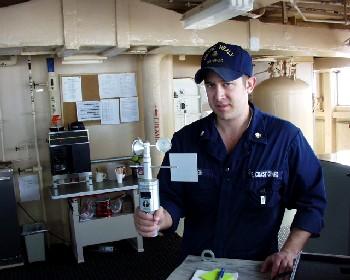
Picture 7 Here I am, taking a sea surface temperature measurement. The temperature recorded on Friday, June 23, 2000 at 10:00 A.M. was -0.4 degrees Celsius, roughly 31 degrees Fahrenheit. Pictures 6 and 7 Sea surface temperature Using a simple device to collect surface water that contains a thermometer, the sea surface temperature can easily be obtained. Period of waves The measurement of time between the crest (top) of one wave and the crest of the following wave. Measured in seconds. True direction of waves Measured in tens of degrees from which the swell waves are coming. Height of waves Cause of ice accretion (growth by a gradual build up) on ship Examples: icing from ocean spray, fog, ocean spray and fog, rain, rain and spray
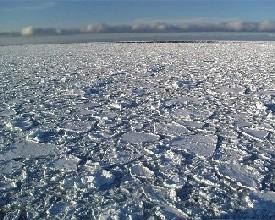
Pancake ice formation Picture 9 Concentration or arrangement of sea ice Examples: pancake, fast ice, strips and patches, etc.
Picture 5 Relative Humidity Using a sling psychrometer, which contains a dry-bulb and a wet-bulb thermometer, the relative humidity can be determined. The dry-bulb thermometer measures the air temperature you feel. The wet-bulb thermometer measures the temperature at 100% humidity. Using a chart, you then use the wet-bulb temperature and the temperature difference between the two thermometers to determine the relative humidity. Cloud Coverage and Cloud Type The percent of cloud coverage is determined as well as the type or types of clouds present. Visibility The distance from the ship that can be seen is also noted. Oceanographic Data Ships true course during the last three hours Measured in degrees. (A heading of 360 degrees is due north.) Ships average speed during the last three hours Measure in knots.
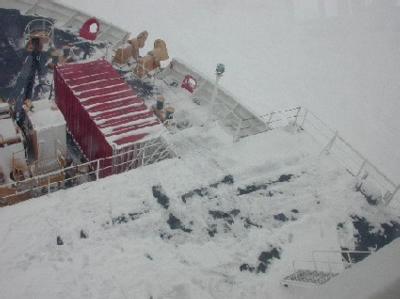
Picture 8 Thickness of ice accretion Measured in centimeters. Rate of ice accretion Relative measurements of slow, medium, etc.
Picture 1 True wind speed in knots Measured by using the ships automated anemometer, or a hand held anemometer.
Contact the TEA in the field at
.
If you cannot connect through your browser, copy the
TEA's e-mail address in the "To:" line of
your favorite e-mail package.
|