
|
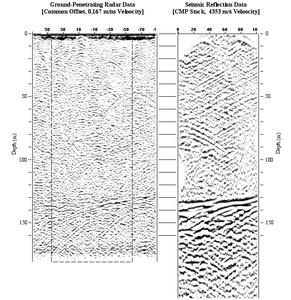
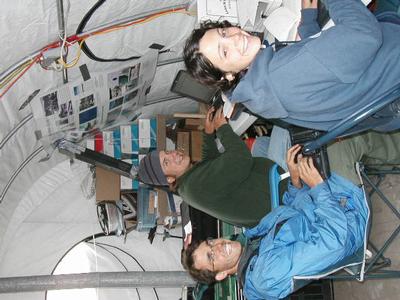
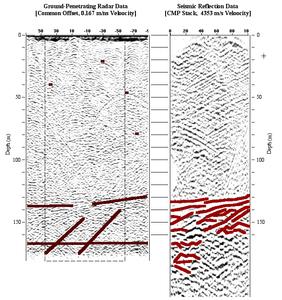
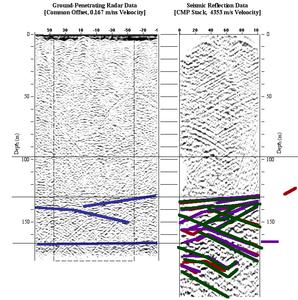
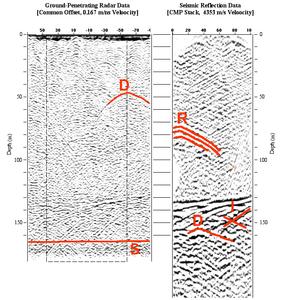
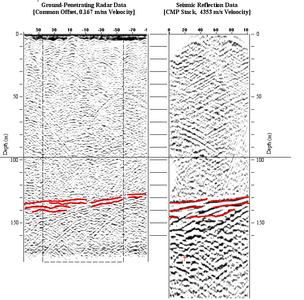
28 July, 2001Visitor from Barrow and Some Technical Information 4:30 p.m. A light rain started falling around 3:30 p.m. Because rain may cause a fuse to blow in the antennae, we ended our data collection several hours early. I am starting my journal early tonight because (a) Greg is leaving early tomorrow and (b) I have a visitor coming to camp!! Life on ice ... almost As we were packing our gear into the car this afternoon to head back to camp, Chris Donavon and her daughter arrived. Chris, a fellow TEA, has just finished her seven-week research stint in Barrow, Alaska, measuring how much carbon dioxide is absorbed into the tundra. Check out her journals: Click here to check them out! She and Megan are spending time touring Alaska before heading back to Arizona, land of paved roads, flush toilets and dark nights. It is amazing the things the body can get used to: the CRREL guys in camp have been here since May and typically wear t-shirts and jeans around camp and on the glacier, while I wear long underwear and my vest from the moment I get up to the moment I go to sleep. Two weeks ago, I couldn't sleep for the constant light; now, it's no problem. Indeed, Chris and I discussed how tricky it will be for our bodies to readjust to dark nights. Other news: Greg and Kendra head to Ft. Wainwright (outside Fairbanks) tomorrow to complete a short seismic study up there. They are trying to map more accurately the bedrock, permafrost and pollution near the runways there. Jet fuel has spilled and the army is trying to determine if their efforts to clean it up were successful. Pretty cool to see geophysics in action! Science at work In yesterday's webcast conference, a question was received via e-mail as the conference was concluding: "Where is the physics in geophysics?" The answer that leaps to mind is "At the end"; somehow, I think the person asking the question (Jeff Dunham, my mentor and physics professor at Middlebury) had something else in mind. A more thoughtful response then. A thorough understanding of physics is necessary to successfully use geophysics because physics (and parcticularly wave theory) is used to ... a) understand the potential applications and limitations of the equipment.< /i> For example, in yesterday's journal I mentioned that the speed of seismic waves in ice at the surface and at the bottom of the ice are different. Physics tells us how and why. Another example: radar measures the electrical differences of matter underground. GPR does not work in clay. Physics helps us understand why. Another example: we place geophones a certain distance apart; we take samples of GPR data at certain intervals. Physics tells us what those intervals should be. b) process and interpret data After all the data has been collected, it must be processed and interpreted. The objective of processing is to improve the "signal" and reduce the "noise". Doing so requires knowledge of the frequencies of the seismic and GPR waves and how to manipulate them. Physics teaches us about waves. Comparing GPR and seismic data requires us to convert time into distance. Physics shows us how. Interpreting the data is the application of wave theory. Scientists looking for reflections in geophysical data must look for and avoid noise that indicate diffractions and interference of seismic and GPR waves. Physics is gives us clues about what this "noise" should look like. c) develop models and hypotheses By using physics, scientists are able to develop new models and run simulations to show how different earth materials would react in different situations. Since we're on the subject, let's talk about interpreting data (hang on to your seats; the ship to really cool thinking is about to take off) Check out the pictures... Think and look carefully. Cheers. ~SM
Contact the TEA in the field at . If you cannot connect through your browser, copy the TEA's e-mail address in the "To:" line of your favorite e-mail package. |