
|
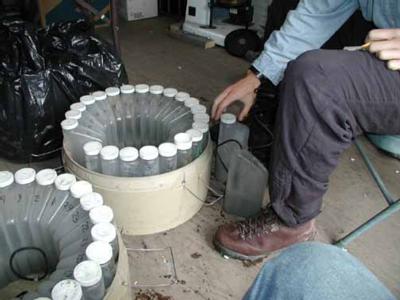
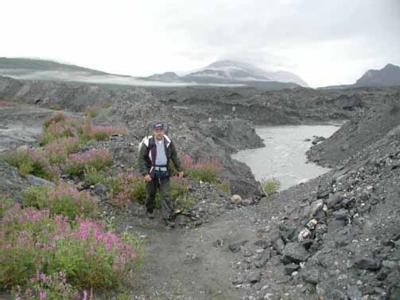
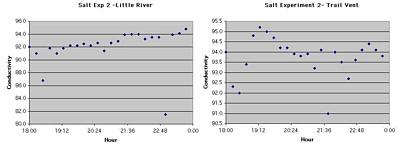
11 July, 2000July 11, 2000 Matanuska Glacier, Alaska A cold dreary morning did not dampen our enthusiasm as we hiked out to retrieve the samples that were collected last night by the two ISCOs. Along the way to both the Trail Vent and Little River Vent I was hopeful that the ISCOs had collected our samples without any problems. Both stations came through for us and we made our way back to camp to test each of the forty eight samples and examine the results. With access to two conductivity meters Ben checked the Trail Vent samples and I worked with those from Little River Vent. We worked very quietly and didn’t have much conversation. I think both of us were deep in thought about what we were seeing as we moved from bottle to bottle. For my part I was mostly seeing a rather constant value show up in each sample. But then I began to see a change in the values. Could this be it? The values had been fluttering about 92 microsiemens for about three hours but quickly the values went up and hovered around 94. Was this significant? I remained quiet and kept testing each successive sample. We happened to finish at about the same time and began to discuss what we were seeing in the results. We both had conductivities in the same general range but neither of us saw a significant change in them. Was there anything in the data that would suggest that we’d found a connecting moulin/vent pair? I suggested we put the data into a spreadsheet and look for patterns or trends in the data. We quickly got the data entered and graphed. Hmmmm..... Try to be objective here..... It seems you can always take given information and make it say what you want it to say. It is very tempting to do so yet always foolish to jump to a conclusion from just a single experiment and one set of data. Even though it appears that something could be said from this data there are still some issues that need to be looked at. One issue we discussed is how did the rain influence the results. It ought to dilute the samples. If not for the rain would there have been more pronounced changes? We originally had hoped to take advantage of the low flow during the night time period to reduce dilution. Does the conductivity normally have fluctuations of a couple digits? We took samples over a very short period of time. Perhaps we just saw small bits of natural fluctuations in conductivity. Maybe we ought to toss in even more salt in order to make a more pronounced spike, if indeed we are getting one. We decided to take samples again tonight but without dumping salt. This will provide some idea of the “normal” conditions. Provided the weather conditions seem similar, we will then repeat this tomorrow night with salt. Perhaps then we can go a bit further in determining a connection between our moulin and the vents. This afternoon we worked a bit with the centrifuge that we’ll use to quickly settle out the sediment in our samples. This is not necessary for our conductivity measurements but is essential once we start using the fluorometer. The presence of suspended sediment (cloudiness) in the sample prevents the fluorometer from obtaining accurate readings. Hopefully it won’t be long before we make our connections and can proceed with the dye tracing phase of the project. In the meantime we want to be sure that all equipment is ready to go when the time comes. Marvin Giesting
Contact the TEA in the field at . If you cannot connect through your browser, copy the TEA's e-mail address in the "To:" line of your favorite e-mail package. |