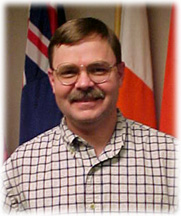
Hi. My name is Marvin Giesting and I teach Chemistry and Advanced
Placement Physics at Connersville High School in rural southeastern
Indiana. This is my hometown and I have been teaching here for 16 years. I
am also the webmaster for the high school's website as well as for the
Hoosier Association of Science Teachers, Inc. I have a Bachelors degree
from Indiana University and a Masters degree from Ball State University. I
have a big interest in incorporating computer technology into my
curriculum, utilizing the use of webpages for personal classroom resources
and also using the computer with a lab interface to gather and analyze lab
data.
Along with my wife Kim (also a TEA) and our Sheltie Malcolm, we enjoy
living on three rolling acres in the country where we grow lots of
vegetables and fruits during the summer. We both enjoy traveling and have
explored Japan extensively as well as Belize, Ecuador and much of the
United States and Canada. We enjoy outdoor activities such as camping,
hiking, rafting and canoeing. My personal hobbies include woodworking,
gardening and restoring/collecting electromechanical pinball and arcade
games.
I am really looking forward to my experiences in Alaska and eventually
returning to the classroom to share them.

Dye Tracer Study of the Matanuska Glacier Subglacial Hydrologic System
Dr. Edward Evenson, Lehigh University
I will be working with Dr. Ed Evenson of Lehigh University on the
Matanuska Glacier in the Chugach Mountains of Alaska. The research will
involve a one month study of the subglacial drainage system of the
Matanuska Glacier. We will try to determine the geometry of the subglacial
hydrologic system by dye tracer studies which is a standard technique in
studying glacier hydrology. We will inject concentrated dye "slugs" into
moulins (holes in the glacier) located 1-3 km upglacier of the terminus
and, using ISCO automatic water samplers, recover water on an hourly basis
from the exit vents located at the glacier terminus. This water will be
filtered and run through a fluorometer to establish a dye concentration
vs. time curve. Mathematical analysis of the dye curve can be used to
model the shape and connectivity of the subglacial conduit system.