|
|
5 March, 2000
The Knee Question
73 40 s 115 05 w
Depth 945 m (3100 ft)
Temp -7 C (19 F), Winds 24 knots (28 mph) out of SE
Barometer 991.3 mb, steady
Course 268 (almost due west), speed 5.2 knots (6 mph)
Ship running a seismic line between Cape Herlacher and Wright Island, to
investigate trough
Breaking new ice, some older floes and occasional battered, jagged old
bergs about
I have examined some difficult scientific questions in my
journals, and I will do some more. But I have a more basic one posed to me
by my daughter Emeline, among others. The question is this: Do penguins
have knees? I'm not sure where this question came from, but it certainly is
a valid one.
I haven't found the answer yet. I have not been able to get close
enough to a penguin to tell, and if I could it would probably squawk (do
penguins squawk?) and wiggle and peck me. The Nathaniel B. Palmer has had
bird experts on past cruises, but there are none aboard now. I've included
two photos of emperor penguins, though. You can look at them and see if you
think the birds have knees.
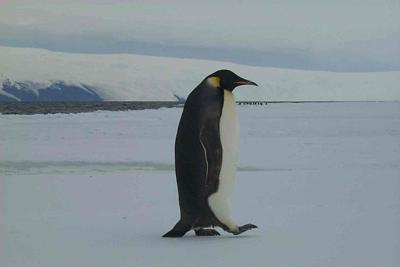
In the walking picture, you can see the bird's straight right leg as it
strides, and the foot of the other leg. It also looks like the penguin is
using its tail to balance. I'll have to remember to look at the snow to see
if the tail leaves a track. The penguin's left leg, the one hidden by its
tummy, would be the bent one, if it has knees. Try walking fairly fast
across the room. The leg out in front is nearly straight and the one behind
is bent. That's what the emperor is doing.
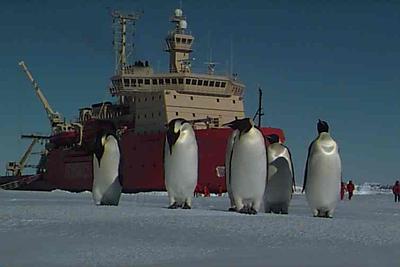
The other picture shows several penguins posing in front of the
Nathaniel B. Palmer. Their legs are showing, but it is hard to tell if they
have kneecaps. If they were little kid penguins (they're actually adults)
and they had knees, you would probably see them all scraped up, so you
would know for sure. For now the question remains unanswered.
These are emperor penguins, and knees or not, they are pretty
birds. They also have some interesting behaviors. For example, the females
lay one egg each in late fall or winter, then leave while the males
incubate the eggs. The males do this by holding it on their feet and
against their warm stomachs, for a month or two. Eventually the mother, who
has been off feeding, returns and takes over.
There's another thing about these birds, which I don't think many
people know, so I'll tell you. Drew Logan pointed this out to me, and
showed me a video he had taken of it. Later I watched the same thing
through binoculars. Drew helps keep all the computers and electronic gear
on the Nathaniel B. Palmer operating properly.
Remember how I told you that emperor penguins can slide along on
their bellies, like boats, paddling along with their wings and feet? It
never occurred to me to wonder how they got back up standing once they are
sliding. The video showed me.
To get up, they poke their long sharp beaks into the snow, which
anchors their front ends. Then they grab or scratch the snow with their
feet. Once they get a grip with their feet, they hump up like an inchworm
in the middle, push back with their beaks, and roll up onto their hind
ends. Then they shake a little, and walk off. It is quite a sight to see.
I just looked back at the picture of the Penguins in front of the
Nathaniel B. Palmer. It almost looks like the two penguins on the left are
themselves wondering about the business of knees, and looking down to see
what they've got!
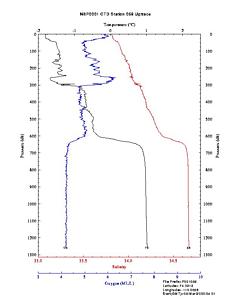
In the February 18 journal entry I described how scientists and
crew aboard the ship made a CTD cast, but I didn't say a lot about what
kind of information they were getting, and what it meant. So I've included
a CTD graph with this journal entry. Let me explain some parts of it.
This CTD was made at a site east of the Bear Peninsula, early this
morning. Right after this CTD was taken, we took a core, all before
breakfast. Thank goodness the plastic core liner came out of the pipe
easily! It was cold out there.
The title at the top lists the cruise number. NBP stands for Nathaniel
B.Palmer, 00 means the year 2000, and 01 means the first cruise of the
year. The 059 means it is the 59th CTD we have done this cruise. "Uptrace"
means the graph was made while the CTD was being pulled up from near the
bottom, rather than while being lowered down. If you look in the lower left
you'll see the latitude and longitude. You will also see the date and
starting time.
There are really three graphs in one here. Notice that the two side scales
are identical. These scales read down from the top, from 0 to about 1300
decibars. A decibar is almost exactly the same as a meter in depth, so what
you are really looking at is depth on the side scales. The surface would be
at the top of the graph, and the bottom would be at about 1250 meters.
The first graph, the black line, shows the temperature of the water at
different depths. You read the depth off either side, and the temperature
off the horizontal scale across the top. The graph shows that the surface
temperature (at the top) is about 1.8 C. Way down deep, say at 900 meters,
the temperature (again, read off the top of the chart) is almost +1 C. How
could water be colder than zero and still be liquid? It has salt in it, and
salt water freezes at lower temperatures than pure fresh water. Also, you
might think water is this cold only in the polar regions, but that is not
true. Most of the water in the oceans of the world is less than 3 C, even
at the equator. It is only the water in the top 200 meters or so that is
warm enough for swimming in the tropics.
The second graph, the blue line marked "OX," shows the amount of dissolved
oxygen in the water. As before, you find the depth on either side, but this
time you read the value from the lowest horizontal scale, which reads
between 3 and 10. The units are not important for this discussion, just
remember the higher the number, the more oxygen. What is important about
dissolved oxygen? For one thing, fish and other organisms need it to
breathe. Water can only get more oxygen at the surface, where wind and
waves and diffusion dissolve it from the air, or plants like diatoms give
it off from photosynthesis. Once water is down deep, no new oxygen
dissolves from the atmosphere, and it is too dark for plants to live and
produce it. Animals, however, keep using it, so the longer a parcticular
water mass is in deeper parts of the ocean, the less oxygen it will have.
Pollution causes bacteria to grow, and many bacteria use oxygen, so
polluted water can run out of oxygen very quickly. Because of pollution,
the ocean water off New York City comes very close to running out of oxygen
during summer, even though it is relatively shallow. There are other ways
water can loose its oxygen, which have nothing to do with people or
pollution. The Black Sea, and some lakes in Africa, have no oxygen at all
below the top layers. Water pumped up from below stinks of hydrogen
sulfide, and only certain bacteria can live below the oxygenated zone.
The third part of the graph, the red line, shows salinity, or the amount of
salt dissolved in the water. You read the salinity off the next to lowest
scale. Salt is added to water by rivers dissolving rocks and carrying it to
the ocean. This process has been going on since the oceans formed. Water
and salt come in, but only water evaporates away.
Salinity may be less where, for example, there is heavy rainfall, or near
melting icebergs. An important thing about salinity is that it is the major
factor in determining how dense water is, and therefore at what level it is
found with respect to other waters. The saltier water is, the denser it is,
and the further it sinks. (The other factor is temperature. Cold water is
heavier than warm water.)
So now that you understand how to read the graph, what does it mean? Why is
Stan Jacobs interested in a CTD from northeast of the Bear Peninsula? Look
at the graph and see if you can figure out why things are as they are. I'll
explain some more tomorrow.

A group of emperors posing in front of the Nathaniel B. Palmer. They have shiny bellies which they slide along on most elegantly. Do they have knees? I don't see any kneecaps. (Dan Naber photo)

An emperor penguin with a purpose in mind. What purpose I don't know. Note the beak and the toes, useful for standing up from a belly slide. Does this bird have knees? (Dan Naber photo)

Here is a raw data CTD trace from east of the Bear Peninsula. The black line is temperature (TE), which is read on the scale across the top. The blue line is dissolved oxygen (OX), which is read on the bottom most scale. Salinity (SA) is shown in red. The vertical scales on each side of the graph are identical. They read the pressure in decibars. Pressure in decibars is almost the same as depth in meters, so this graph represents water nearly 1300 meters (4265 feet) deep. Notice that between 600 and 650 meters deep three things happen. Oxygen content drops, temperature increases, and salinity increases. Below 650 meters the CTD has entered "warm" circumpolar deep water.
Contact the TEA in the field at
.
If you cannot connect through your browser, copy the
TEA's e-mail address in the "To:" line of
your favorite e-mail package.
|
