
|
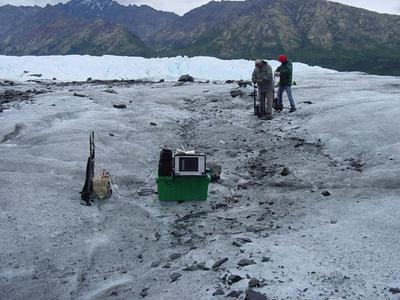
29 July, 2002On the ice...... The weather broke enough today to allow me to collect some GPR data. Darren Bake, and Tim Alessi, two REU students helped me pack the gear up the glacier and then collect data. We were lucky enough to catch a window between showers that provided enough time to gather the data. It was considerably warmer today than yesterday, at least when the wind wasnĻt blowing. However, It was still very cloudy with no hint of clearing up. ItĻs much more difficult to predict what the weather will be like here than at home. There is no nightly weather report to plan the following day by. As mentioned in my journal yesterday, we collected data along four separate profile lines laid out 90o to the flow of the glacier and spaced at 10m intervals up glacier from the hole. I wasnĻt able to tell whether I got good results as the data will need to be processed before a clear image will be able to be seen. We also moved the gear further up ice to a second hole that will be used. For this data set, the hole was left empty. This will serve as comparison for data collected with weights in the hole. Once this data was collected, we set the weights down the hole, one at the bottom (139m), one at 80m and a third at 40m. The weights are supported by line and tied of to a pole that spans the opening of the hole. This rigging will hole the weights in place until they freeze in to the ice. We then ran radar over the same profile line as before. Once again, as this data was collected no clear images were seen, however, processing should clear it up. IĻve attached a couple pictures. One of them shows the process of collecting GPR data on the ice. The other is another processed radar image collected last week. Life Is Good, DT
Contact the TEA in the field at . If you cannot connect through your browser, copy the TEA's e-mail address in the "To:" line of your favorite e-mail package. |