 | |||||||||||||||||||
|
|
Journals 2008/2009Karen Rudio
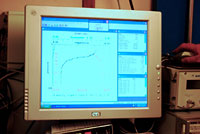
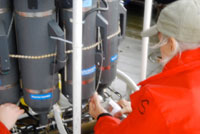
September 13, 2008 This morning after breakfast, I had an informative chat with Russ, who tells me that this week's expedition is part of a time series, a long term observation. About ten years worth of data has been collected so far. This type of research is invaluable for sorting out variability due to seasonal changes versus long term trends such as global warming. It is impossible to make accurate computer models without detailed data. The North Pacific Research Board is one of the few agencies that fund these important studies. The data collected on this cruise will be added to the Marine Census. The Marine Census organizes oceanographic data and sets up meetings where scientists can discuss findings. We will be taking samples from 13 primary stations with nine minor stations in between in the Gulf of Alaska, plus up to 11 stations in Prince William Sound. Both water samples for chemical analysis and zooplankton samples will be taken at all 13 primary stations, but only water samples will be collected at the nine minor stations. This is because it is very time consuming to sort through, identify and count zooplankton samples. Three physical parameters will be taken at every station using a CTD which stands for conductivity (similar to salinity), temperature and depth. Water samples are taken using an array of 12 Niskin bottles. They resemble large tubes with an opening at each end. You send them down opened and then signal them closed one at a time at various depths. This gives you a complete picture of what the water is like at all depths over a site. The research engineer, David Leech, handles the computer with the CTD information and signals the bottles closed on their way up. Typically, water samples are taken at the surface, 10 meters deep, 20m, 30m, 40m, 50m, 75m, 100m, 150m, 200m, 500m and 1000m.
Some water samples will be preserved and taken back to the university lab and analyzed for carbon content by Andy Krumhardt. Andy is the research technician of Dr. Jeremy Mathis. They are studying the carbon cycle.
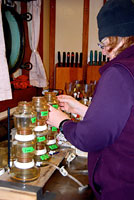
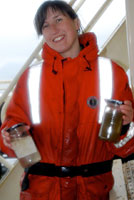
Water samples are also collected from the Niskin bottles by Katherine Trahanovsky. She collects two sets of samples for analysis. She uses small bottles for nutrient analysis. Nutrients are chemicals in the water such as nitrogen, phosphorous and iron that are necessary for phytoplankton to grow. They act like plant fertilizer. She needs larger bottles to study the amount of chlorophyll in the water which gives a good indication as to the productivity of the phytoplankton. Katherine first filters 250ml water through a fine paper filter to obtain an estimate of the total amount of chlorophyll in the sample. Next she does a fractionated sample. She pulls a 500ml of sample water through a 20 micron filter stacked on top of a 5 micron filter on top of a glass fiber filter. The filter with the most chlorophyll gives a rough estimate as to the size of the most abundant phytoplankton at the station. When she gets back to the lab, Katherine will process her filters with acetone and analyze them with a fluorometer. Samples with chlorophyll glow in the dark slightly. It is this glow that the fluorometer is able to detect.
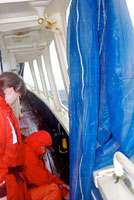
After the CTD with its rosette of Niskin bottles is brought back on deck with the help of the ship's engineer and deck hand, the zooplankton nets were put overboard using the ship's winch.
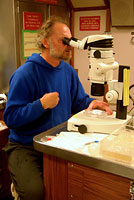
Two different nets were deployed. The first one is used for quantifying the amount of zooplankton at the station. Everything caught in the net will be preserved with formalin and stained with Rose Bengal. Rose Bengal is a pink stain absorbed by some of the zooplankton's tissue. It increases the contrast between body parts making the animals easier to see under a microscope. It also gives a clear indication that the sample has been fully preserved. Each sample is split in half several times and only a portion of each split gets counted. In total, only about 1/500th of each zooplankton sample will be identified to species and counted. It takes three to four hours to go through each sample. The zooplankton from the multi-net will be processed in the same manner. Unfortunately, the technology is not there yet to collect automated zooplankton samples. Copepods comprise the largest proportion of the zooplankton population. There are 12-15 species that are very common in the Gulf of Alaska, another 50-100 that are common, maybe 50 others that are not unusual and anywhere from 300 to 400 others that are possible, but rare. Sometimes warm water species get swept up to Alaska in the coastal currents, especially in warmer years. Ken Coyle often uses Russian taxonomic keys in identifying zooplankton since there was a great deal of research in this field conducted by scientists of the former Soviet Union. In fact, Ken has translated Russian works into English for the Bering Sea Fishermen's Association. He has also written software to pull different data sets together.
The other zooplankton net is used to collect live specimens. Some of the live samples will be sent to a lab conducting molecular analysis. Scientists will isolate the DNA and some proteins of a tiny pteropod (a pelagic snail) and some microscopic jellyfish called siphonophores. Previous studies have looked at zooplankton production rates, growth rates and grazing rates, so the ecology of the animals is pretty well known. What scientists still need to know is how the populations are responding to the environment especially since this past spring was very cool and the season got off to a late start.
Soon after the first station was completely sampled, the seas became quite rough. We moved onto the next station, but most of us newbies, including myself, were pretty seasick and not much help. The stations that were sampled today were RES 2.5 (a station inside Resurrection Bay, just off shore from Seward), GAK1 (Gulf of Alaska 1, a station that has been monitored monthly since the 1970s), GAK1i (i for intermediate, a minor station with no zooplankton samples), and GAK2. The captain and Russ decided to call it a day early and we anchored in a quiet cove for the night. Most of us took advantage of the still water to process samples, eat, and get caught up with our journals. |
||||||||||||||||||