 | |||||||||||||||||
|
|
Journals 2007/2008Mark Goldner
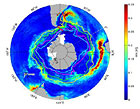
November 16, 2007 57° 23' S 64° 22' W Before relating the events of today, I thought I'd step back and discuss the reason behind all this effort: Why come to the Drake Passage to measure ocean currents, pressure, density, etc.? After all, the amount of time, energy, money and other resources that went into this cruise is enormous. Physical Oceanographers are interested in understanding the "dynamics of the ocean." In other words, they would like to know about the movement of water, energy and heat through the ocean. Moving water is known as a "current". Ocean currents can be thought of like giant rivers moving through the ocean. Ocean currents are very large and very complex; for example, what happens on the surface is often quite different from what happens deep in the ocean. In some places, deep ocean currents can literally be moving in the opposite direction from surface currents! Why might an oceanographer be interested in studying ocean currents? Well, by understanding how the ocean works we can make predictions about the future. For example, our climate is strongly dependent on what happens in the ocean. And, our oceans are influenced by what happens to our climate. The atmosphere and the ocean are intricately linked. So by studying the ocean, you can learn a lot about our climate. In particular, the group of oceanographers I have joined is interested in knowing more about the largest ocean current in the world, called the Antarctic Circumpolar Current (or ACC, for short). The ACC has as much water moving through it as 280 Amazon Rivers!!
The Drake Passage is known as the "chokepoint" of the ACC, which means it's where the ACC has to pass through its narrowest point. The way that water, heat, salt and nutrients move through the Drake Passage is very important for understanding ecology and our climate.
You can think of a large ocean current like the ACC as similar to the Jet Stream. The jet stream is a band of strong winds that move around the globe. Because of changes in air temperature in different regions, changes or fluctuations in the Jet Stream are created. These fluctuations are seen as spinning masses of air, which can form storms. The same phenomenon happens in the ocean, but with water instead of air. Fluctuations in large-scale currents like the ACC or the Gulf Stream cause fluctuations, or eddies, to form. These eddies are like storms inside the ocean. You can see eddy formation in other fluids. Consider a nice stream of water coming out of the tap - when it nears the bottom it becomes more random and twisted as eddies form. Another example would be smoke rising from a candle. As it rises higher and higher small eddies of smoke form. There are a few big questions they want to know the answers to, including:
These are, of course, very complicated questions. And the data takes years to collect and years to interpret. Being an oceanographer does require patience! How do you study what goes on deep in the ocean? This is where the fun comes in. The ocean is really, really deep. Oceanographers have designed instruments that they can send down deep in the ocean, even to the sea floor, to measure all sorts of things. Of course the trick is getting the data back. Over the next several days I'll go into some detail about the various instruments that we are using on this cruise to collect data.
By the way, you can monitor some of the data being collected, and track the progress of the ship, by going to the following website:
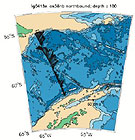
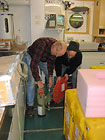
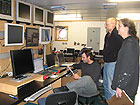
Over the last couple of days we seem to have settled into our routine. Each one of us has been assigned a 12-hour "watch," which is when we work on completing whatever duties need to be accomplished. Every few hours we deploy a "CPIES" (Current and Pressure monitoring Inverted Echo Sounder). The process takes about an hour or so, much of which is spent setting up things on the back deck of the ship. That's when we get to wear the ultra-cool "float coats" and hard hats. In the interim I help with an ongoing mapping project called Multi-beam acoustic mapping. I'll discuss this in a later post, but in short it's a way we are mapping the sea floor as we travel over it. Then of course there are meals (which have been excellent!), except when an instrument deployment happens to occur in the middle of a meal.
Today was another very calm day, and the weather was very pleasant. The skies cleared a bit yesterday evening, and today we saw quite a bit of sun. I was really warm while on deck with all my warm weather gear on, and I actually had to don my sunglasses! |
||||||||||||||||