 | |||||||||||||||||||
|
|
Journals 2008/2009Roy Arezzo
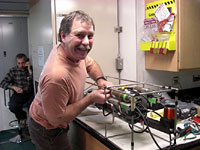
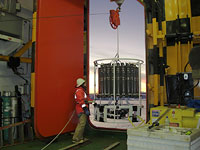
August 1, 2008 We have begun our transit to Chile and are headed back through the Drake Passage. Although the sampling has ended, there are a few remaining specimens to dissect and some folks I did not see all day; banished to the cold room to finish the work. The Chief Scientist is busy writing reports. I made time to start looking at some of the data we collected. In the Introduction to New York Harbor Field Class I co-teach back in New York City, the students visit various parts of the NY/NJ estuary system and conduct water quality testing. We use field test kits to measure the turbidity, salinity, dissolved oxygen, temperature, pH and nutrient levels. The brackish water of the estuary in New York City is influenced by the Atlantic Ocean and fresh water inputs from industry, runoff and various rivers like the Hudson. The impact of industrial discharges and sewage over the last two centuries has greatly impacted the oxygen levels and by the early 1980s the benthic layer was mostly hypoxic. Since amendments to the Clean Water Act of 1972 have been put into action, the oxygen levels have rebounded and life is back in the harbor. Part of our curriculum includes a stewardship component and studying the factors that influence water quality. Antarctica, in stark contrast, is relatively pristine but still sensitive to the negative affects of industry and human impact through warming. I plan to use some of the data from the FOODBANCS2 project back at school as a comparison between our local waters and the Southern Ocean. I met with Greg Watson, an Electronics Technician (ET), who has worked in Antarctica for a long time, about the water quality data we collected on our cruise. The CTD unit (conductivity, temperature and density sensor) is a water quality sensor that attaches to a rosette rack equipped with water collection bottles (Niskin bottles). When we deploy the CTD unit from the Baltic Room, the ETs monitor the operation from the Aft Dry Lab. Here they can remotely open valves to collect water at different depths. We use the water samples for a host of experiments including measuring phytoplankton and the percentage of organic carbon. The CTD sensor measures water quality data continuously up and down the water column as it is deployed to a desired depth. For most parameters the units of measurement recorded by the CTD are the same as the units of measure my students and I use in the field; the one exception being oxygen. Greg took some time to run a report that converted oxygen readings to milligrams per liter (equivalent to parts per million) so my students can understand the significance of the oxygen values.
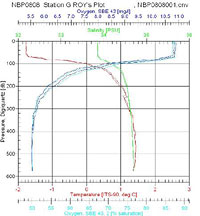
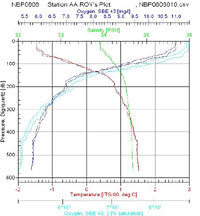
I looked over the data from the two stations at opposite ends of our latitudinal transect and made few observations. Anecdotally, I found Antarctic waters to have a very low turbidity. The clarity of the water is attributed to low suspended solids due to less inputs from pollution and runoff and little winter phytoplankton growth. We were able to see some of the equipment deployed into the sea for up to 35 meters below the surface before it was lost from sight. The pH tends to be a standard 8.2 for ocean water and it is not typically measured by the CTD sensors. The water temperature is around freezing but we found the surface water in all our sites to be somewhat colder than the deeper water. The surface temperatures at Station G were lower in temperature than the northern stations and had a more defined cold water layer above the thermocline between the surface and 100 meters. The salinity averaged between 34 and 35 parts per thousand. Since salt water is denser than seawater, we typically find higher salt concentrations in deeper water; however, due to the influence of the ice, we did find some variation on the layering of dense salt water. At the northern end of the transect (Station AA) we found a smoother salt gradient with depth where as Station G, presumably affected by surface ice, had a defined layer of water with a lower concentration of salt in the top 100 meters. Overall the dissolved oxygen levels are high in this part of the Southern Ocean. Cold water has a greater capacity to hold oxygen and with little pollution out here, this was not too surprising a result. The oxygen levels decreased with depth at all of our stations as a result of less mixing with the air at the surface. Station G had slightly less dissolved oxygen in near the surface. Ice can reduce oxygen by serving as a barrier for air water exchange and sunlight. What stands out the most is fluorescence data that measures phytoplankton biomass. With less light intensity there is simply less phytoplankton in the euphotic zone. Another limiting agent for biological activity is the nutrient levels. The cold water has slower cycling of materials in general and the FOODBANCS2 projects data from sediment traps and water analysis will tell us more in the next few months.
|
||||||||||||||||||