|
|
Journals 2003/2004
Sarah Quan
Narragansett High School, Narragansett, RI
"Study of the exchange of waters between the Northeast Atlantic and the Norwegian Sea"
R/V Johan Hjort, Nordic Seas
July 10 - 30, 2003 m
|
July 16, 2003
Latitude: 65º 0.619' N
Longitude: 7º 0.117' W
We have clear sunny skies and very calm seas, almost glasslike. There is virtually no wind. Last night we deployed the second mooring. We reached the drop spot around 21:30 at which point the captain used sonar to scan the bottom to find a flat spot to drop the mooring on. The computer program they use has the bathymetry (depth contours) of the ocean. As you pass over a spot it will adapt the 3-D image based on the data your sonar gives it. Only a small portion of the ocean is accurately mapped. When we got to the drop point this evening we found a seamount that no one was expecting which speaks to how much we don't know about the oceans. As a result we had to shorten the mooring rope by 200 meters so that the sound source would still be positioned at 550 meters in 1800 meters of water.
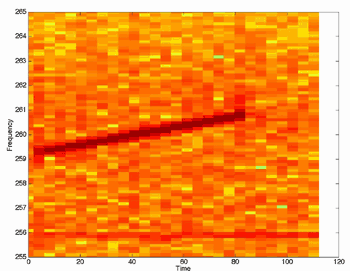
 Today we took the small rescue boat out about 2 km from the ship so we could get away from the noise of the ship and hopefully hear the signal from the two sound sources that we had deployed. We threw a hydrophone overboard. It was connected to a voltmeter, an amplifier, and a computer. A signal was due in at 16:06 from the first mooring (it went off at 16:00 and it took an additional 6 minutes to travel the 540 kilometers to where we were stationed at a rate of 1500m/s. 16:06 came and went with no sizeable jump in milivolts on the voltmeter, and not much graphically on the computer. No one was too surprised considering how far away we were. The signal from the second mooring was due in at 16:32. Everyone was staring anxiously at the voltmeter, which sure enough, right on time, began to chaotically cycle up and down. We looked to the computer whose job it was to make sense of the signal and there appeared a dark line at just the right frequency. The illustration here shows clearly the signal slowly increasing from 259-261 Hz. Tom and Henrik, the two scientists on board, who have been working to get this project off the ground for 10 years, cheered and threw their arms up in victory at the sight of this apparent simple dark line.

|
|