 | |||||||||||||
|
|
Journals 2008/2009Cheryl Manning
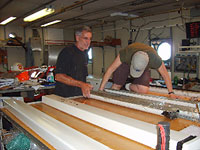
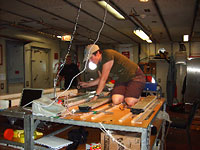
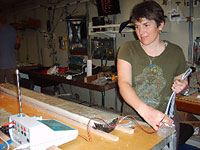
January 20, 2009 When the mud finally gets to my table for the sedimentology team to analyze, we use many different tools to figure out what we are looking at.
First, we scrape the surface perpendicular to the core so that it is smooth and shows the stratification. With a quick but careful examination, we can define the different strata or layers. Then, using a toothpick to take the tiniest sample of sediment from each layer, we make a microscope slide to identify the type of sediment. From the two sites that we have sampled, we have been able to identify foraminifera, radiolarians, and diatoms in a matrix of calcium carbonate with some clay; all of this together makes ooze -- that is the official name of the mud we are coring. We have also found ancient volcanic ash layers that are interbedded with the oozes. We expect to see fewer and fewer foraminifera and more and more of the radiolarians and diatoms in a siliceous ooze and as we get closer to Hawaii, we will begin to see more and more red clay.
The descriptions of the sediment are logged centimeter by centimeter in a computer database for anyone to look up. We use the Munsell Soil Color Charts to be less vague about the colors that we are seeing. If a scientist ever wants to look at these core they can get the database first then go to the University of Rhode Island, Graduate School of Oceanography to look at the section that they want to see. The purpose of this voyage is to develop a better understanding of how microorganisms live below the surface of the seafloor. Subseafloor water, what is living in it, and what is dissolved in it is an essential part of this puzzle. So we measure the electrical conductivity of the sediment to figure out how readily the fluids move up or down the column of sediment. In seawater, conductivity goes up as the temperature goes down, so I measure the temperature as well. Each measurement is taken every 10 cm and takes about a minute to get. At the end of each 1.5-meter section of core, we check the instruments by taking a conductivity measurement of seawater. The conductivity and temperature are recorded first in a lab book then logged into an Excel spreadsheet. All the data is graphed and analyzed using the distance below seafloor as the frame of reference.
Questions:
|
||||||||||||