 | |||||||||||||
|
|
Journals 2009/2010Teresa Gable
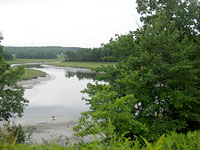
August 11, 2009 Today, I was introduced to Sherman Marsh. I participated with an all women science team, Abby Pearson, Elizabeth Mitchell and Jennifer Moutinho. We traveled into the marsh early in the morning. One of the problems with working in the salt marsh is timing with the tides. It is a very wet environment with areas of unstable soil. You have to be aware of where you step at all times. Carrying a pole with you to test the muddy areas is an essential tool for working in a marsh. I topped my boot a few times and sunk into the mud most of the day. On the way out of the marsh we had to travel around the edge of the forest to avoid the high tide water.
For 70 years Sherman Marsh was a shallow freshwater lake formed by the construction of Route 1 in the 1930's across the tidal creek of a salt marsh. In 2005, the dam that separated the lake from a tidal river broke and salt water was re-introduced. The purpose of the research is to monitor the change from a fresh water environment to a salt marsh environment. The plants are an indicator that the changes have begun because they are easy to see. This is an observational project and the 22 transects are inventoried once a year. Each transect has several permanent plots. The plots are 1x1 square meters and each transect runs from the edge of the creek to the edge of the forest. Depending on the distance, each transect may have 3 to 20 plots along the transect line. One of the challenges of working on this project was finding the markers which identified the location of each plot.
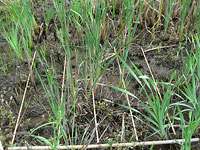
In 2006, the first transects were laid and the permanent plots were set. Each summer, each plot is re-visited (all 134 plots) and each plant is inventoried and compared with the previous years data. The purpose of the data collection is to see changes over time. The data is collected in the same plot, using the same techniques and the same tools to keep everything controlled. The changes in vegetation can be noticed from year to year. There are fewer cattails and more saltwater tolerant plants moving in, such as black rush (Juncus gerardii). We found evidence that more salt tolerant species are moving in while visiting a plot today. We noticed there was a shift from the Eleocharis acicularis (freshwater daf spike rush) to Eleocharis parvula (salt-tolerant daf spike rush). This was a valuable observation.
|
||||||||||||