 | |||||||||||||||||||
|
|
Journals 2008/2009Steve Howard
August 25, 2008 Earlier in this journal I gave an overview of the primary mission for this expedition, mapping targeted areas of the Arctic seafloor. There's a great deal of complex technology behind these maps, and I sat down today with Brian Calder who took some time to explain to me how the data is collected and used to create these striking maps of the seafloor topography. Brian, who works for the Center for Coastal & Ocean Mapping Joint Hydrographic Center at the University of New Hampshire (CCOM), has been on all the Healy Arctic mapping cruises (this is the fourth one) and is an expert in data processing and management. After meeting with Brian, I think I've got a better handle on what's going on "behind the pretty pictures." A caveat... there's going to be some oversimplifications in my description, but hopefully this will paint a basic picture for someone new to the topic (like me!).
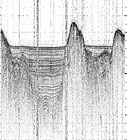
As I understand it, the seafloor maps are essentially constructed from two major sources of echo-sounder data, a "multibeam" system and a single beam "Knudsen." Both do the same basic job- to bounce a sound signal from the ship to the seafloor and back- but they do it in some significantly different ways. Let's start with the Knudsen. The Knudsen is a type of single-beam echo-sounder, Knudsen Engineering Inc. being the company who makes this particular device. To generate a sound, an electrical signal is sent to the Knudsen's array of ceramic transducers, which are mounted on the ship's hull (you can think of the transducers as a combination of loudspeaker and microphone, since they do both jobs at different times). The transducers distort their shape in response to the electrical signal, which generates sound in the water. If you could listen to the sound that's made it's like a bird chirping - so it's typically called a 'chirp' echo-sounder. In fact, you can hear this "chirp" from just about anywhere on the ship. This sound (chirp) signal propagates straight down from the ship through the water column until it hits the seafloor, after which it "bounces" back to the ship. Using the speed of sound through water (which is typically about 1,500 meters per second), the computer collects the time the signal takes to leave the ship and return, and determines the distance (depth) from the ship to the seafloor.  Because this "chirp" is a very low frequency signal, it is able to penetrate into the seafloor sediments, sometimes for up to 50 meters, and therefore also provides information about the type of sedimentation found at that specific area of the seafloor. This is very important to the mission, since seeing changes in the sedimentation of the seafloor helps these scientists understand the sort of geological structures that the ship is passing over, which are very important to constructing the overall picture of how the seafloor came to be the way it is now.
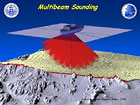
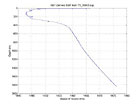
A drawback to the Knudsen is that it projects a single beam straight down below the ship. This is kind of like trying to find a marble in a pitch-black room using only a small beam flashlight; you'd want to turn on a wider bank of lights to illuminate the whole area. Well, that's where the "multibeam" echo-sounder comes in. The multibeam uses an array of transmitters which simultaneously gathers 121 measurements on depth across a swath of seafloor. These signals are much higher in frequency, so although they don't give data on seafloor sedimentation they give excellent detail about seafloor topography. You have to be careful when using the multibeam, though, because it is very sensitive to changes in sound speed through different depths of water. To respond to this, probes are sent down (called eXpendable BathyThermographs, or "XBTs") to carefully measure sound speed along the water column, and this data is used to keep the multibeam's depth calculations accurate.
As the information from the Knudsen and the multibeam comes in, Brian (and three rotating teams of graduate students) verifies the data for accuracy and works with some very sophisticated software to make 3-dimensional images of the seafloor topography. He also organizes the data in ways that are most suitable for the analyses that will follow to determine the potential for an extended continental shelf for the U.S.
|
||||||||||||||||||