 | |||||||||||||
|
|
Journals 2009/2010Jonathan Pazol
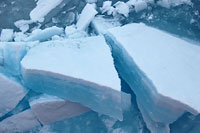
August 16, 2009 Last night, the Healy reached its farthest point east on this leg of the trip (80.37° N and 136.59° W). Ice coverage was quite extensive, and we bumped through several large ridges, which made quite the grinding noise, sort of like when something metal falls down a garbage disposal - except on a much larger scale. The broken ice chunks travel along the side of the ship and are fascinating to watch (and not only because I'm a self-described science geek and here in the Arctic without consistent internet access). They are up to several meters thick, have various layers, break up into irregular shapes and, as I described to my son and daughter, "have the color of blue-raspberry sno-cones."
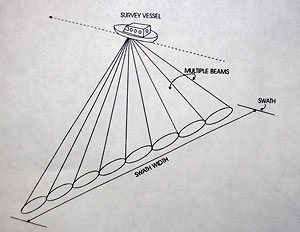
I've been learning more and more about the technology behind the mapping that we are doing on this expedition. Looking at the Arctic Ocean floor from a distance of 3800 meters (2.3 miles) cannot be done with cameras or even satellites because of the tremendous water depth and ice coverage. Bathymetry, the science of mapping using sound waves, has advanced tremendously over the years. Early ocean mapping or echosounding systems used an instrument that sent out a single sound beam (ping) to the ocean floor, received it as it bounced back to the receiver, and then calculated the distance using the time it took to travel back and the speed of sound in the water (1500 meters per second - here in the Arctic about 1440 m/s because of the cold temperature). Then, another beam would have to be sent out from a slightly different location then the first, and the process would have to be repeated over and over again. Once the data was recorded, the points could be plotted and then a map could be formed. This is obviously a tedious and inefficient process - imagine trying to paint a picture by dipping a toothpick into a can of paint and applying it to the canvas one dot at a time (I have a new appreciation for the works of artist, Georges Seurat). A more sophisticated tool, called a multibeam echosounder, is what is currently used on the Healy and on ships around the world. Multibeam echosounder instruments send out multiple beams of sound in a single ping and reach many different locations at once. The beams are arranged next to each other, so that they form a wide strip or swath across the ocean floor. In the case of our mapping, this swath is 10 kilometers (6 miles) wide.
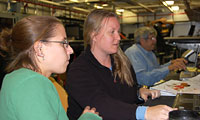
The receivers picking up the reflected pings are monitored by computers. They record the number of beams received, usually about 90, but less when they're disrupted by floating ice, and turn them into a depth profile graph. This display is one of the things that we have to monitor while on watch. We make sure that the data is being recorded at the most optimal level. If there are problems, then we adjust the collection method to get the best data points. Once the information is received, several scientists on each watch are responsible for analyzing or "cleaning" the data. They use a special computer program to remove "outliers" - those data points that do not represent depth measurements but may be reporting interference from the ship's movements, ice, etc. Then this is displayed on the ship's Map Server, an interactive web-based computer program that shows the path of the ship and the mapping results.
Our mapping over the past several days has been of the flat ocean floor, and our Map Server has still only displayed the "long, straight purple line" that I've joked about in previous entries. Nevertheless, it is amazing to think that the areas that we are covering have never been mapped before by anyone using this technology and at this level of detail. This project, compared by geophysicist John Hall, to "mowing the lawn with a pair of nail clippers," is huge in scope but will provide useful information to scientists around the world for years to come. |
||||||||||||