 | |||||||||||||||||||
|
|
Journals 2009/2010Jonathan Pazol
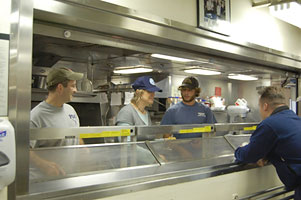
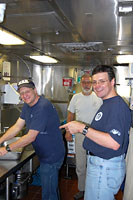
August 22, 2009 How many scientists does it take to cook a jambalaya? No, this is not the start of a bad joke. The science Party was in charge of Morale Night (Saturday) dinner for everyone on the Healy. We decided to break tradition from pizza and burgers and do something special. Several members of our group have southern roots, so we decided to make a Cajun feast - okra in tomato sauce, chicken and sausage jambalaya, shrimp grits, and corn bread. Everyone took part, from chopping pounds of onions, to cooking, to serving (and convincing skeptical Healy crew to try some new dishes), to cleaning. We managed to pull off a meal without major injuries, setting anything on fire, or driving the Food Service specialists too crazy.
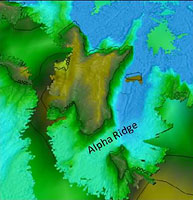
Every minute that we have spent aboard the Healy during this expedition, we have been collecting data. The multibeam echosounder and the "Chirp" system run 24 hours a day, 7 days a week. Millions of data points have been collected and then processed by the 7 scientists assigned that task during their watches. That data then gets uploaded into a computer software program that puts it all together. This program, called Fledermaus, which Chief scientist Larry Mayer helped to develop, is an interactive three-dimensional (3D) tool that provides a way to prepare, analyze and present data. It was designed for the display of geographic features, such as mountains or ocean floors but has many other uses as well. The program takes the processed data and can display it as surfaces, images, points, lines or even cross-sections. The bathymetric data can be positioned over a geographic map and looked at from "above" to see the features of a particular area. The picture below shows this type of display from multibeam data in an area of the Arctic Ocean called the Alpha Ridge.
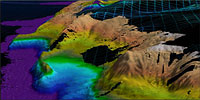
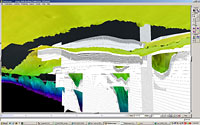
Fledermaus can also take the data, color-band the surface features according to their height, and then display them in a 3D format on a map, such as the IBCAO (International Bathymetric Chart of the Arctic Ocean) map. This picture shows a map of the Northwind Ridge - the western edge of the Chukchi Borderland. Areas based on imported data points are displayed in color. Areas that appear as a black grid are areas where there is no multibeam data to overlay on the IBCAO map.
In addition, seismic data can be imported and displayed simultaneously along with the multibeam data. One of the most amazing features of the software is that all of the displays can be rotated in 3D to look at a location from any angle, including underneath. And, there is a 3D "flight mode," where the user can "fly" through a map to see various geographic changes - it's like a video game for scientific purposes.
In addition to mapping, Fledermaus has been used to show before and after images of dredging for shipping channels, the positioning of pipelines, chemical reactions, and crop growth rates. It has even been used to map the locations of ships, caissons (temporary docks/breakwaters), and tanks off the coast of Normandy left over from the D-Day invasion of WWII. |
||||||||||||||||||