
 | |||||||||
|
|
Journals 2006/2007Miriam Sutton
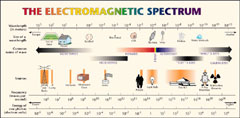
August 18, 2006 AM Location: Saglek Bank (58° 57' 55.16" N, 61° 45' 59.44" W) I am constantly surrounded by waves. I don't just mean the waves on the sea surface that I can see each day while I'm working in the seismic lab. I'm talking about waves above and below the sea surface that I cannot see. You don't have to be living on a ship to be surrounded by waves either. Waves are everywhere around us every minute of every day and most of them are totally invisible to the naked eye. If we could actually see all of the waves around us everyday, we wouldn't be able to see anything else. Our world would be cluttered with waves. So just what are waves and where do they come from in such abundance? Energy produces waves which can be generated in a variety of mediums, including light, heat, and sound. Some energy produces waves we can see, such as the colors of a rainbow which demonstrate the spectrum or energy waves known as visible light. The Sun produces energy in the form of light and heat which we can see and feel as the waves of energy undulate toward Earth. Energy also produces waves we can hear, such as the music we listen to on our MP3 players. (See Electromagnetic Spectrum diagram below.)
Waves are very important to the research being completed by the Geologic Survey of Canada scientists. Specifically, they are interested in sound waves that can be controlled and measured between the ship and the seafloor sediment beneath us. In the next few entries, we will explore the mysterious world of sound waves that travel beneath the sea and learn how scientists can bounce a wave off the seafloor and determine if the substrate is soft mud or hard rock. Use today's activity to get acquainted with one of the key components in the scientists' research: wavelength and frequency. Today's activity: The scientists are sending (or transmitting) low frequency waves from the ship to assist them "seeing" the structure of the seafloor and the layers of sediment buried beneath the seafloor. Using the Electromagnetic Spectrum diagram, discuss which type of energy wave you think the scientists are using to create a graphic image of the seafloor. (You may want to review the journal entry on August 12, 2006.) Word of the Day: Undulate REMINDER: Record today's Sea Surface Temperature (SST) and the Air Temperature on the data table you created from the August 05 journal entry. |
||||||||
