 | |||||||||||||
|
|
Journals 2006/2007Miriam Sutton
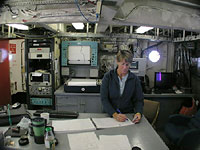
August 6, 2006 AM Location: Orphan Spur (51° 11' 35.17" N, 49° 19' 20.87" W) I began my first shift at 8:00AM and began receiving my on-the-job training for the core sampling and seismic data logging protocol. The Chief Research Scientist, Calvin Campbell, and one of his cohorts, Paul Fraser assisted me in learning about the computer software, the data logging system, depth sounding equipment, and the coring operation. My primary job during the cruise will be to monitor the coring and seismic data collection processes and record a daily log of activities. (See Canadian Geologic Survey Logbook photo below.)
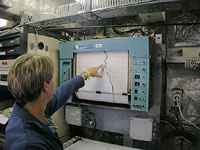
The scientists are also using bottom sounders to record the depth. A series of "pings" are transmitted and received by one of the ship's computers. This signal is converted to a printout that can be read in fathoms. I will also monitor this instrument to assist the coring operators with depth recordings needed before deploying the coring apparatus. (See photo of Line Scan Recorder below.)
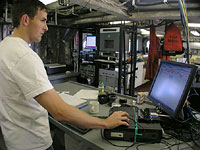
The fathoms are also recorded and into the digital logbook which is designed on an EXCEL spreadsheet. Formulas have been programmed to convert the fathoms to meters. All of the data I record in the CGS logbook is also entered into a software program to secure a digital record of the surveys being completed. (See Spreadsheet View photo below.)
Today's activity: Place a piece of paper on a wooden table top (such as a dining table). Take a pencil and begin writing your name on the paper as a friend starts beating on the table. Observe the changes in your handwriting. Discuss with your friend what caused the changes in your writing. How does your paper compare with the printout shown on the Line Scan Recorder above? Word of the Day: Seismic REMINDER: Record today's Sea Surface Temperature (SST) and the Air Temperature on the data table you created from the August 05 journal entry. |
||||||||||||